Age-Grading Performance Calculator
What the Calculator Does
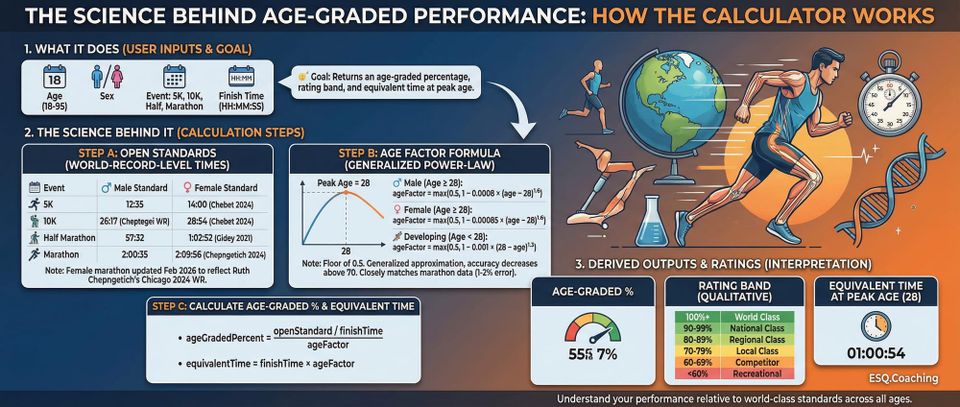
Enter your age (18-95), sex (male or female), event (5K, 10K, half marathon, or marathon), and finish time in HH:MM:SS or MM:SS format. The calculator returns an age-graded percentage, a rating band, and the equivalent time you would have run at peak age.
How the Calculator Works
Inputs
- Age: Accepted from 18 to 95.
- Sex: Male or female, used to select both the age factor formula and the open standard.
- Event: 5K, 10K, half marathon, or marathon.
- Finish Time: Any completed race time in HH:MM:SS or MM:SS format. Times under 5 minutes are rejected as unrealistic.
Open Standards
The calculator uses current world-record-level times as open standards - the fastest known performance for each event at peak age (approximately 28). These are hardcoded in seconds:
| Event | Male | Female |
|---|---|---|
| 5K | 12:35 | 14:00 (Chebet 2024) |
| 10K | 26:17 (Cheptegei WR) | 28:54 (Chebet 2024) |
| Half Marathon | 57:32 | 1:02:52 (Gidey 2021) |
| Marathon | 2:00:35 | 2:09:56 (Chepngetich, Chicago 2024) |
Note: The female marathon standard was updated to 7796 seconds (2:09:56) in February 2026 to reflect Ruth Chepngetich's Chicago 2024 world record, correcting the previous value of 7913 seconds.
Age Factor Formula
The calculator uses a generalized power-law approximation of WMA age-grading factors. Peak age is fixed at 28. For athletes at or above peak age:
- Male: ageFactor = max(0.5, 1 − 0.0008 × (age − 28)1.6)
- Female: ageFactor = max(0.5, 1 − 0.00085 × (age − 28)1.6)
For developing athletes under 28:
- Both sexes: ageFactor = max(0.5, 1 − 0.001 × (28 − age)1.3)
The floor of 0.5 prevents any age factor from dropping below 50%.
This is a generalized approximation - not the full WMA lookup tables. Official WMA tables contain event-specific and age-specific factors derived from millions of performances. This formula closely matches marathon data (within 1-2%) and is a reasonable approximation for ages 35-70, but accuracy decreases above 70.
Age-Graded Time
The age-graded time is what you would have run at peak age, given your current fitness level:
Age-Graded Time = Actual Time × Age Factor
The age factor is less than 1 for athletes over 28, so the age-graded time is faster than the actual time. For example, a 45-year-old male has an age factor near 0.91. A 45-minute 10K becomes approximately 41 minutes at peak-age equivalent.
Age-Graded Percentage
Age-Graded Percentage = (Open Standard / Age-Graded Time) × 100
This expresses your age-graded time as a fraction of the open standard. A score of 100% means your age-graded time equals the world record for your sex and event. A score of 75% means your graded time is 75% as fast as that world record.
Rating Bands
| Percentage | Rating |
|---|---|
| 100%+ | World Class |
| 90-100% | National Class |
| 80-90% | Regional Class |
| 70-80% | Local Competitive |
| 60-70% | Above Average |
| 50-60% | Average |
| Below 50% | Recreational |
Safety Guard
Athletes over 55 receive an uncertainty notice: age-grade estimates carry increased uncertainty (up to +/-7%) at higher ages. Athletes over 70 receive an additional notice that age-grade estimates carry high uncertainty (up to +/-15%) at advanced ages and that the polynomial approximation diverges significantly. For competitive masters grading at these ages, consult published WMA tables directly.
Practical Application
Scenario 1: The 45-Year-Old Marathon Runner
Sarah runs a 3:25:00 marathon at age 45.
- Age factor (female, 45): 1 − 0.00085 × (45 − 28)1.6 = approximately 0.909
- Age-graded time: 3:25:00 × 0.909 ≈ 3:06:27
- Open standard (female marathon): 2:09:56 (7796 seconds)
- Age-graded percentage: 7796 / (3:06:27 in seconds) = approximately 63%
- Rating: Above Average
Sarah is performing solidly for her age. A 3:25 marathon at 45 reflects genuine fitness, even if the raw time looks modest compared to younger runners.
Scenario 2: The 62-Year-Old 10K Specialist
Tom runs a 42:00 10K at age 62.
- Age factor (male, 62): 1 − 0.0008 × (62 − 28)1.6 = approximately 0.757
- Age-graded time: 42:00 × 0.757 ≈ 31:47
- Open standard (male 10K): 26:17 (1577 seconds)
- Age-graded percentage: approximately 62%
- Rating: Above Average
Tom's club-level performance in raw time translates to a competitive equivalent when age-adjusted.
Scenario 3: Goal Setting Across Ages
Maria wants to know what marathon time at 55 would match her personal best of 3:10:00 from age 32.
- Age factor (female, 32): 1 − 0.00085 × (32 − 28)1.6 = approximately 0.994
- Age factor (female, 55): 1 − 0.00085 × (55 − 28)1.6 = approximately 0.833
- Ratio: 0.994 / 0.833 = approximately 1.193
- Equivalent target: 3:10:00 × 1.193 ≈ 3:47:00
A 3:47 marathon at 55 represents the same relative fitness as her 3:10 at 32. Any time faster than that indicates genuine improvement relative to her age peers.
Why Age Grading Matters
Raw times are a poor measure of fitness across decades. A 45-minute 10K at age 60 can represent a higher level of relative fitness than a 38-minute 10K at age 25. Age grading answers the question runners over 35 all ask: how much of my slowdown is normal decline, and how much is detraining?
For masters athletes, the percentage has practical uses: goal setting, year-over-year fitness tracking, and cross-event comparison. A 75% age-graded marathon and a 75% age-graded 5K represent the same relative fitness level, making the percentage a useful single number across all distances.
The Research
Age grading as a formal system originated with the World Association of Veteran Athletes (WAVA, now WMA), which first adopted age-grading factors in 1989. The methodology has gone through major revisions in 1994, 2006, 2010, 2015, and 2023.
The 2023 update analyzed over 2.8 million performances, including longitudinal tracking of individual athletes across decades. This was a critical improvement over earlier cross-sectional methods that compared the best performers at each age in a single year - a method biased by the fact that faster athletes tend to race longer.
Research findings on age-related performance decline in endurance running:
- Before age 35: Negligible decline for well-trained runners.
- Ages 35-40: Approximately 1% total decline over five years (Tanaka and Seals, 2008).
- Ages 40-70: Linear decline of approximately 0.5-1% per year for highly trained athletes; closer to 1% per year for the broader running population (Baker and Tang, 2010).
- Ages 70-90: Acceleration to approximately 1.5% per year.
- Ages 90+: Declines of 2-3% per year (Rittweger et al., 2009).
The physiological drivers are established: declining VO2max (approximately 5-10% per decade after age 30), reduced muscle fiber recruitment, decreased muscle elasticity, and hormonal changes.
Limitations
Approximation vs. lookup tables. The single power-law formula cannot replicate the event-specific, data-driven WMA tables. The calculator is inspired by the WMA system, not a direct implementation of it. Results are typically within 1-2% of WMA values for marathon ages 35-65, but accuracy degrades above 70 and may vary for shorter distances.
Individual variation. Age grading reflects population-level trends. Genetics, training history, injury, and lifestyle create wide individual variation. Two athletes with the same age-graded percentage may have very different training trajectories.
Course and conditions. Age grading assumes a standard road course and neutral conditions. A 3:30 marathon on a hilly, hot course is not the same performance as 3:30 on a flat, cool course.
Self-selection bias. The WMA factors derive from competitive masters athletes - people who continued training and racing into older age. The decline curves may underestimate performance loss for the general population.
Moving standards. Open standards must be updated as new world records are set. This calculator uses standards current through 2024.
ℹ️ IMPORTANT DISCLAIMER
This calculator is for educational purposes only and does NOT constitute medical advice. Consult qualified professionals before making changes. Individual physiology varies. You assume all risk. Must be 18+.
References
Baker, A. B., & Tang, Y. Q. (2010). Aging performance for masters records in athletics, swimming, rowing, cycling, triathlon, and weightlifting. Experimental Aging Research, 36(4), 453-477.
Reaburn, P., & Dascombe, B. (2008). Endurance performance in masters athletes. European Review of Aging and Physical Activity, 5(1), 31-42.
Rittweger, J., di Prampero, P. E., Maffulli, N., & Narici, M. V. (2009). Sprint and endurance power and ageing: An analysis of master athletic world records. Proceedings of the Royal Society B, 276(1657), 683-689.
Tanaka, H., & Seals, D. R. (2008). Endurance exercise performance in masters athletes: Age-associated changes and underlying physiological mechanisms. Journal of Physiology, 586(1), 55-63.
World Masters Athletics. (2023). WMA age factors and parameters 2023 edition. Retrieved from https://world-masters-athletics.org
Grubb, H. (2023). WMA Track and Field age-grading calculator 2023. Retrieved from https://howardgrubb.co.uk/athletics/wmatnf23.html
Jones, A. L. (2004). Age-grade tables for road running. Retrieved from https://github.com/AlanLyttonJones/Age-Grade-Tables