Altitude Performance Adjustment
The Science Behind It
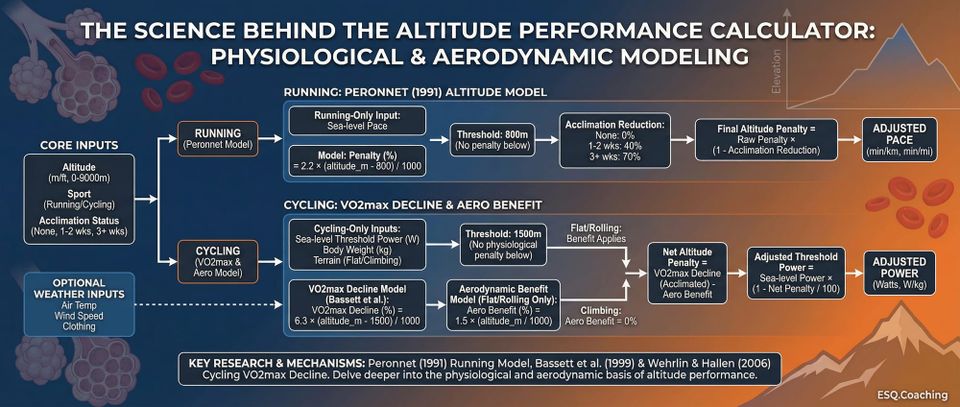
How the Calculator Works
The calculator has six required inputs and three optional weather inputs:
Core inputs:
- Altitude (meters or feet, 0-9000m)
- Sport (running or cycling)
- Acclimation status (not acclimated, 1-2 weeks, 3+ weeks)
Running-only inputs:
- Sea-level pace (MM:SS format, per km or per mile)
Cycling-only inputs:
- Sea-level Threshold Power (watts)
- Body weight (kg)
- Primary terrain (flat/rolling or climbing)
Optional weather inputs:
- Air temperature at start elevation (°C)
- Wind speed (km/h)
- Clothing level (race kit, light layers, moderate, full winter)
Running: Peronnet (1991) Altitude Model
Running performance penalty uses a linear model derived from Peronnet, Thibault & Cousineau (1991):
Penalty (%) = 2.2 × (altitudem - 800) / 1000
The threshold is 800m - no penalty below this. Above 800m, performance degrades 2.2% per additional 1000m of elevation.
Acclimation reduces the penalty:
- Not acclimated: 0% reduction (full penalty applies)
- 1-2 weeks: 40% reduction
- 3+ weeks: 70% reduction
Final altitude penalty = raw penalty × (1 - acclimation reduction)
Cycling: VO2max Decline and Aero Benefit
For cycling, the calculator combines a physiological penalty with an aerodynamic benefit.
VO2max decline - linear model based on Bassett et al. (1999) and confirmed by Wehrlin & Hallen (2006):
VO2max decline (%) = 6.3 × (altitudem - 1500) / 1000
Threshold is 1500m for cycling. No physiological penalty is applied below this.
Aerodynamic benefit - applies to flat/rolling terrain only:
Aero benefit (%) = 1.5 × (altitudem / 1000)
Reduced air density lowers aerodynamic drag. On flat terrain, this partially offsets the physiological penalty. On climbing terrain, gravity forces dominate and the aero benefit is set to zero.
Net altitude penalty = VO2max decline (after acclimation) - aero benefit
The same acclimation reductions (40% partial, 70% full) apply to the VO2max component before netting against the aero benefit.
Adjusted Threshold Power = sea-level threshold power × (1 − net penalty / 100)
Results show adjusted power in watts and W/kg.
Weather Model: Cold and Wind
Temperature, wind, and clothing are optional. When provided, they add a cold/wind penalty on top of the altitude penalty.
Temperature at altitude - standard atmospheric lapse rate:
Temp at altitude (°C) = base temp - 6.5 × (altitudem / 1000)
Wind chill - NWS/Environment Canada formula (Osczevski & Bluestein, 2005), valid when temp <= 10°C and wind > 4.8 km/h:
Wind chill = 13.12 + 0.6215 × T - 11.37 × V0.16 + 0.3965 × T × V0.16
where T = temperature in °C, V = wind speed in km/h. When conditions fall outside this range, the actual air temperature is used as the felt temperature.
Cold performance penalty - based on Castellani & Young (2016) and Nimmo (2004):
- Felt temp >= 10°C: 0% penalty
- 0 to 10°C: 0.3% per degree below 10°C (up to 3% at 0°C)
- Below 0°C: 3% base + 0.5% per degree below 0°C (accelerated loss from respiratory heat loss, bronchoconstriction, and peripheral vasoconstriction)
Clothing modifier scales the cold penalty:
- Race kit (minimal): 1.2x (20% more exposure)
- Light layers: 1.0x (baseline)
- Moderate (jacket, tights): 0.7x
- Full winter kit: 0.5x
Effective cold penalty = raw penalty × clothing modifier
Total performance penalty = altitude penalty + cold/wind penalty
Safety Bands (AMS/HACE/HAPE)
The calculator applies safety warnings based on altitude and acclimation status:
| Condition | Altitude | Acclimation | Warning Level |
|---|---|---|---|
| Extreme altitude | > 5500m | Any | Emergency - HACE/HAPE risk very high |
| High altitude, unacclimated | > 3500m | None | Critical - AMS risk, consider acetazolamide |
| High altitude | > 3000m | Any | Info - ascend max 500m/day, rest days |
| Moderate altitude, unacclimated | 2500-3000m | None | Warning - AMS/HAPE advisory (WMS/Luks 2019) |
Frostbite warnings are added separately when wind chill drops to -28°C (High risk) or below -40°C (Very High risk).
Air Density
Air density at altitude is calculated using the barometric scale height approximation:
Air density = 1.225 × exp(-altitudem / 8500) kg/m³
This is displayed as a percentage of sea-level density and used to frame the aerodynamic context.
Altitude Classification
- Low Altitude: < 1200m
- Moderate Altitude: 1200-2500m
- High Altitude: 2500-3500m
- Very High Altitude: > 3500m
Worked Example: Running
A runner with a sea-level pace of 5:00/km racing at 2500m, no acclimation:
- Altitude above threshold: 2500 - 800 = 1700m
- Raw penalty: 2.2 × 1.7 = 3.74%
- Acclimation reduction: 0% (not acclimated)
- Final penalty: 3.74%
- Adjusted pace: 5:00 × 1.0374 = 5:11/km
Adding weather: base temp 5°C, wind 30 km/h, light layers:
- Temperature at 2500m: 5 - 6.5 × 2.5 = -11.25°C
- Wind chill: 13.12 + 0.6215 × (-11.25) - 11.37 × 300.16 + 0.3965 × (-11.25) × 300.16 ≈ -19°C
- Cold penalty (below 0°C): 3 + 0.5 × 19 = 12.5%
- Clothing modifier (light layers): 1.0x
- Total penalty: 3.74% + 12.5% = 16.24%
- Adjusted pace: 5:00 × 1.1624 = 5:49/km
Worked Example: Cycling
A 70kg cyclist with 250W sea-level threshold power on a flat course at 2000m, 1-2 weeks acclimation:
- VO2max decline: 6.3 × (2000 - 1500) / 1000 = 3.15%
- Acclimation reduction: 40%
- Reduced VO2 penalty: 3.15 × 0.60 = 1.89%
- Aero benefit (flat): 1.5 × 2.0 = 3.0%
- Net altitude effect: 1.89 - 3.0 = -1.11% (net benefit)
- Adjusted threshold: 250 × 1.0111 = 252.8W
The aero benefit on flat terrain at 2000m slightly exceeds the physiological penalty for a partially acclimated rider.
Practical Application
-
Race goal setting at altitude: Racing a half marathon at 1800m from sea level. Sea-level goal of 1:30:00 carries a penalty of 2.2 × 1.0 = 2.2%. Adjusted target: 1:30:00 × 1.022 ≈ 1:32:00. Starting at goal pace risks a hard collapse in the second half.
-
Training camp calibration: At a 2000m training camp, your sea-level threshold pace of 3:45/km has a 2.64% penalty applied. The equivalent effort pace at altitude is 3:51/km. Slower sessions are not lost fitness - they reflect available oxygen, not effort level.
-
Cycling terrain strategy: At 2500m on a flat course, an unacclimated rider faces a VO2max penalty of 6.3 × 1.0 = 6.3%, offset by a 3.75% aero benefit, for a net 2.55% loss. The same rider climbing gains no aero benefit and loses 6.3%.
-
Cold + altitude stacking: High mountain sportives in spring or autumn can stack altitude and cold penalties significantly. A 3000m climb with 5°C air and 40 km/h wind (and a cycling-generated apparent wind on the descent) can add 10-15% cold penalty on top of altitude losses. The calculator makes this combination visible.
Why This Matters
Altitude is one of the most quantifiable environmental factors in endurance sport. The performance penalty from a moderate altitude race venue is not a matter of "feeling tired" - it follows predictable physiological mechanics. Knowing the expected penalty helps set realistic targets, avoid red-lining in the first kilometre of an altitude event, and calibrate training data from camps at elevation.
The cold and wind extension matters because altitude venues are frequently cold and exposed. A mountain stage finish at 2000m in cool, windy conditions combines two major environmental stressors. Running or cycling without accounting for both leads to consistently poor pacing and race execution.
The Research
Peronnet, Thibault & Cousineau (1991)
Published in the European Journal of Applied Physiology (70(1): 399-404), this paper presented a theoretical mathematical model of how altitude affects running performance. The authors built on an earlier (1989) model of human running performance relating average power output to anaerobic capacity, maximal aerobic power, and endurance capability. They incorporated the effect of reduced barometric pressure at altitude on oxygen availability.
Their model predicted performance losses begin above approximately 800m, with a roughly linear 2.2% decline per 1000m above that threshold. This relationship underpins the running performance model in the calculator. The model is theoretical rather than empirically derived from race results, which is an important limitation - the actual performance decrement in races is affected by pacing strategy, heat, wind, and individual variation in altitude sensitivity.
Bassett et al. (1999) and the VO2max Decline Rate
Bassett, D.R., Kyle, C.R., Passfield, L., Broker, J.P., & Burke, E.R. (1999) published in Medicine & Science in Sports & Exercise (31(11): 1665-1676) an empirical analysis of world cycling hour records from 1967-1996. The study derived equations to compare performances accounting for aerodynamic equipment and altitude.
The calculator uses the 6.3% per 1000m VO2max decline rate associated with this body of work, applied as a simple linear model above 1500m. This rate was subsequently confirmed empirically by Wehrlin & Hallen (2006).
The aerodynamic benefit modeled for flat cycling terrain (1.5% per 1000m) reflects the principle established in the Bassett analysis: reduced air density lowers aerodynamic drag, and for flat time-trial efforts, this can partially or fully offset the physiological penalty at moderate altitude. This is why Eddy Merckx set his 1972 hour record at altitude in Mexico City (2250m) - the aerodynamic savings outweighed the VO2max loss for that effort.
Wehrlin & Hallen (2006)
Published in the European Journal of Applied Physiology (96(4): 404-412), this study tested 8 endurance-trained athletes in a hypobaric chamber at simulated altitudes of 300, 800, 1300, 1800, 2300, and 2800m in a randomized, double-blind design.
Key findings:
- VO2max declined linearly from 66 ml/kg/min at 300m to 55 ml/kg/min at 2800m
- This corresponded to 6.3% per 1000m (range: 4.6-7.5% across individuals)
- Time to exhaustion at constant velocity decreased 14.5% per 1000m between 300 and 2800m
Notably, the VO2max decline was linear from near sea level (300m), not from 1500m. The calculator's 1500m threshold for the cycling VO2max model is a deliberate simplification; at moderate altitudes (1000-1500m) the magnitude of effect is small enough that the approximation holds for practical race planning purposes.
Cold and Wind: Castellani & Young (2016) and Nimmo (2004)
Castellani, J.W. & Young, A.J. (2016) in the Journal of Applied Physiology established the 0.3% per °C performance penalty below 10°C through controlled cold exposure studies. Nimmo, M. (2004) in the Journal of Sports Sciences documented the accelerated performance loss below 0°C driven by respiratory heat loss, bronchoconstriction from cold-dry air, and peripheral vasoconstriction redirecting blood from working muscles.
The wind chill formula is the NWS/Environment Canada standard (Osczevski & Bluestein, 2005), validated against human skin temperature measurements and adopted as the operational standard by both agencies in 2001. It is valid for temperatures at or below 10°C and wind speeds above 4.8 km/h.
Limitations
-
The 1500m cycling threshold understates moderate altitude effects. The Wehrlin data shows linear VO2max decline from near sea level. Athletes at 1000-1500m will see measurable effects not captured by the model.
-
The 2.2% running figure is a theoretical estimate. Race data suggests performance decrements of 3-5% per 1000m for endurance events in non-acclimated runners, particularly at marathon distance where athletes operate closer to their VO2max ceiling. The 2.2% figure may be appropriate for shorter events (5K-10K) and underestimate the penalty for longer races.
-
Individual altitude sensitivity varies. The Wehrlin study found a range of 4.6-7.5% VO2max decline per 1000m across eight subjects. Some athletes are altitude responders; others are relatively resilient. Performance estimates above 2500m carry increased uncertainty.
-
The acclimation reductions (40%/70%) are approximations. The actual adaptation timeline depends on altitude reached, individual hematological response, and training load during the acclimation period.
-
Cold penalty is independent of sport-specific factors. Cyclists generate self-imposed wind from forward motion even in still air, increasing effective wind chill on descents. The calculator uses the entered wind speed only - athletes should account for descent speed when estimating exposure.
-
The Peronnet model is theoretical. It was not directly validated against a large empirical dataset of altitude race performances.
🚨 CRITICAL SAFETY WARNING
This calculator involves conditions that can cause serious injury or life-threatening complications if misapplied. Consult a physician before use.
ℹ️ IMPORTANT DISCLAIMER
This calculator is for educational purposes only and does NOT constitute medical advice. Consult qualified professionals before making changes. Individual physiology varies. You assume all risk. Must be 18+.
References
-
Peronnet, F., Thibault, G., & Cousineau, D. L. (1991). A theoretical analysis of the effect of altitude on running performance. European Journal of Applied Physiology, 70(1), 399-404.
-
Bassett, D. R. Jr., Kyle, C. R., Passfield, L., Broker, J. P., & Burke, E. R. (1999). Comparing cycling world hour records, 1967-1996: Modeling with empirical data. Medicine & Science in Sports & Exercise, 31(11), 1665-1676.
-
Wehrlin, J. P., & Hallen, J. (2006). Linear decrease in VO2max and performance with increasing altitude in endurance athletes. European Journal of Applied Physiology, 96(4), 404-412. https://doi.org/10.1007/s00421-005-0081-9
-
Osczevski, R., & Bluestein, M. (2005). The new wind chill equivalent temperature chart. Bulletin of the American Meteorological Society, 86(10), 1453-1458.
-
Castellani, J. W., & Young, A. J. (2016). Human physiological responses to cold exposure: Acute responses and acclimatization to prolonged exposure. Autonomic Neuroscience, 196, 63-74.
-
Nimmo, M. (2004). Exercise in the cold. Journal of Sports Sciences, 22(10), 898-916.
-
Luks, A. M., Auerbach, P. S., Freer, L., et al. (2019). Wilderness Medical Society clinical practice guidelines for the prevention and treatment of acute altitude illness. Wilderness & Environmental Medicine, 30(4S), S3-S18.
-
Chapman, R. F., Stray-Gundersen, J., & Levine, B. D. (1998). Individual variation in response to altitude training. Journal of Applied Physiology, 85(4), 1448-1456.
Scientific Validation Notes
Assessment: Formulas accurately implemented; key limitations are documented.
Running model (Peronnet 1991, 2.2% per 1000m above 800m):
This value is sourced from the Peronnet theoretical model. It is a reasonable estimate for trained athletes in events up to half marathon. Empirical race data suggests 3-5% per 1000m for longer events. The 800m threshold is consistent with Peronnet's analysis. The model does not include running aerodynamic benefit (small but non-zero at high speeds).
Cycling VO2max decline (Bassett/Wehrlin, 6.3% per 1000m above 1500m):
The 6.3% rate is directly supported by Wehrlin & Hallen (2006) and consistent with Bassett et al. (1999). The 1500m threshold is a simplification; the Wehrlin data show linear decline from 300m. For practical race planning at 1000-1500m, this threshold introduces modest underestimation.
Aerodynamic benefit (1.5% per 1000m, flat terrain only):
The magnitude is consistent with published cycling aerodynamics literature (air density decreases approximately 11-12% per 1000m; power saved from reduced drag is smaller because speed changes with the cube root of power). Terrain gating (zero benefit on climbs) is physiologically appropriate.
Acclimation reductions (40%/70%):
These fall within the published range of 20-50% adaptation for partial acclimation and 50-80% for full acclimation after 3+ weeks. They represent reasonable central estimates.
Cold model (Castellani 0.3%/°C, Nimmo below 0°C):
The linear 0.3%/°C figure is consistent with controlled cold exposure research. The acceleration below 0°C is physiologically grounded. The clothing modifier is a practical heuristic without a precise published equivalent, but the direction and relative magnitudes are defensible.
Safety thresholds:
AMS/HAPE warning at 2500m (non-acclimated) and HACE/HAPE emergency at 5500m are consistent with WMS 2019 guidelines (Luks et al.) and standard altitude medicine references.