Daily Calorie & Macronutrient Needs
The Science Behind It
Understanding your daily energy requirements is fundamental to athletic performance, recovery, and long-term health. This calculator uses validated metabolic equations to estimate your Total Daily Energy Expenditure (TDEE) and provides evidence-based macronutrient recommendations tailored to endurance athletes.
How the Calculator Works
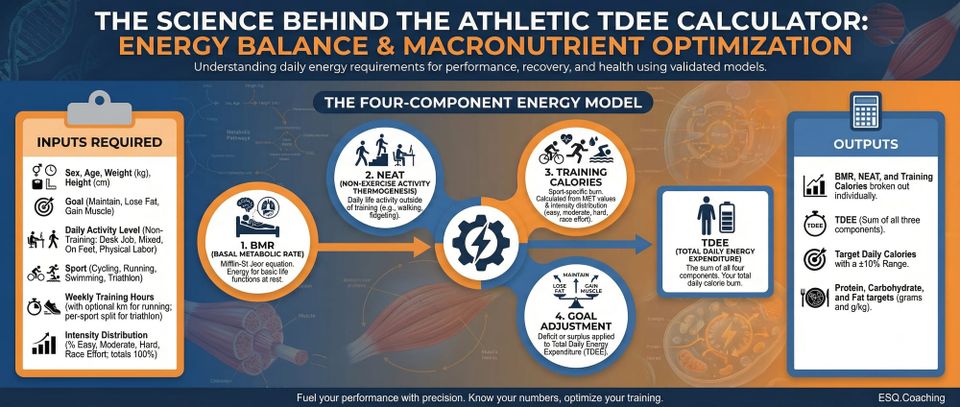
The calculator follows a four-component energy model:
- BMR - Basal Metabolic Rate via Mifflin-St Jeor equation
- NEAT - Non-Exercise Activity Thermogenesis (daily life outside training)
- Training calories - Sport-specific calorie burn from MET values and intensity distribution
- Goal adjustment - Deficit or surplus applied to TDEE
Inputs required:
- Sex, age, weight (kg), height (cm)
- Goal: maintain weight, lose fat, or gain muscle
- Daily activity level (non-training): desk job, mixed, on feet, physical labor
- Sport: cycling, running, swimming, or triathlon
- Weekly training hours (with optional km for running; per-sport hour split for triathlon)
- Intensity distribution: percentage of training at easy, moderate, hard, and race effort (must total 100%)
Outputs:
- BMR, NEAT, and training calories broken out individually
- TDEE (sum of all three components)
- Target daily calories with a +/-10% range
- Protein, carbohydrate, and fat targets in grams and g/kg
The Calculations
Step 1: BMR via Mifflin-St Jeor
The calculator uses the Mifflin-St Jeor equation (Mifflin et al., 1990), validated as the most accurate general-population BMR predictor:
- Males: BMR = (10 x weight_kg) + (6.25 x height_cm) - (5 x age) + 5
- Females: BMR = (10 x weight_kg) + (6.25 x height_cm) - (5 x age) - 161
Worked example - 32-year-old male, 75 kg, 178 cm:
BMR = (10 x 75) + (6.25 x 178) - (5 x 32) + 5 = 750 + 1112.5 - 160 + 5 = 1707.5 kcal
This equation predicts resting metabolic rate within +/-10% for approximately 82% of individuals in validation studies. No Harris-Benedict option is offered - Mifflin-St Jeor is consistently more accurate in modern populations.
Step 2: NEAT (Non-Training Activity)
NEAT captures the calories burned through daily life outside of deliberate training. The calculator multiplies BMR by a lifestyle factor, then subtracts BMR to isolate the NEAT increment:
NEAT calories = BMR x (factor - 1)
| Activity Level | Factor | Typical profile |
|---|---|---|
| Desk job | 1.2 | Mostly sitting |
| Mixed | 1.3 | Some standing and walking |
| On feet | 1.4 | Teaching, retail, service work |
| Physical labor | 1.5 | Construction, manual trade |
Continuing the example - desk job factor 1.2:
NEAT = 1707.5 x (1.2 - 1) = 1707.5 x 0.2 = 341.5 kcal
Step 3: Training Calories via MET Values
Training calorie burn is calculated from the Compendium of Physical Activities (Ainsworth et al., 2011) using intensity-weighted MET values. The calculator uses net MET (gross MET minus 1) to avoid double-counting resting metabolism that is already included in BMR.
MET values by sport and intensity:
| Sport | Easy | Moderate | Hard | Race |
|---|---|---|---|---|
| Cycling | 6.8 | 8.0 | 10.0 | 14.0 |
| Running | 8.3 | 9.8 | 12.3 | 14.5 |
| Swimming | 5.8 | 7.0 | 9.8 | 12.0 |
Intensity-weighted average MET:
avgMET = (easy% x MET_easy + moderate% x MET_moderate + hard% x MET_hard + race% x MET_race) / 100
Net MET: netMET = avgMET - 1
Weekly training calories:
trainingKcal_weekly = netMET x weight_kg x hours_weekly x 1.05
The 1.05 correction factor accounts for excess post-exercise oxygen consumption (EPOC) and the thermal effect of activity. Training calories per day = weekly total / 7.
Worked example - 75 kg cyclist, 10 hours/week, 70% easy / 20% moderate / 10% hard / 0% race:
avgMET = (0.70 x 6.8) + (0.20 x 8.0) + (0.10 x 10.0) + (0 x 14.0) = 4.76 + 1.60 + 1.00 = 7.36
netMET = 7.36 - 1 = 6.36
trainingKcal_weekly = 6.36 x 75 x 10 x 1.05 = 5,008 kcal
trainingKcal_per_day = 5008 / 7 = 715 kcal
Triathlon - per-discipline split, each discipline calculated independently using its sport-specific MET table, then summed.
Running with distance input - when weekly km is provided, the calculator uses a gross cost of 1.0 kcal/kg/km, then subtracts resting energy that would have been burned during that time (assuming 10 km/h average pace) to produce a net figure comparable to the MET method.
Step 4: TDEE and Goal Adjustment
TDEE = BMR + NEAT + Training (per day)
Continuing the example:
TDEE = 1708 + 342 + 715 = 2,765 kcal
Goal adjustments:
- Maintain weight: target = TDEE
- Lose fat: target = TDEE - 500 kcal (targets approximately 0.5 kg/week loss)
- Gain muscle: target = TDEE + 300 kcal (targets approximately 0.25 kg/week gain)
A +/-10% range is displayed around the target to reflect measurement uncertainty inherent in population equations.
Macronutrient Targets
Protein - Dynamic Scaling
Protein is not a fixed percentage of calories. The calculator scales continuously with training load, intensity, goal, and sport using evidence from Thomas et al. (2016) and Phillips & Van Loon (2011):
Base from training volume:
proteinPerKg = 1.0 + (0.04 x min(hours, 20))
Examples: 5 h/week = 1.2 g/kg, 10 h/week = 1.4 g/kg, 15 h/week = 1.6 g/kg, 20 h/week = 1.8 g/kg
Intensity adjustment:
+0.01 g/kg per percentage point of training that is hard or race effort
Example: 10% hard + 5% race = 15% x 0.01 = +0.15 g/kg
Sport adjustment:
Running and run-heavy triathlon add +0.15 g/kg to reflect greater eccentric muscle damage from impact.
Goal adjustment:
- Fat loss: +0.3 g/kg (preserves lean mass in a deficit)
- Muscle gain: +0.15 g/kg (supports muscle protein synthesis)
Clamped to evidence-based range: 1.4-2.2 g/kg, rounded to the nearest 0.1.
Worked example - 10 h/week cyclist, 10% hard, maintain weight:
proteinPerKg = 1.0 + (0.04 x 10) + (0.01 x 10) = 1.0 + 0.40 + 0.10 = 1.5 g/kg (clamped, in range)
Protein grams = 1.5 x 75 = 113 g (452 kcal)
Fat - Endocrine Floor
Fat is allocated to meet the strictest (highest) of three minimums:
- Absolute floor: 50 g (essential fatty acid and hormone production baseline)
- Body weight floor: 0.9 g/kg
- Calorie floor: 20% of target calories / 9
For a 75 kg athlete at 2765 kcal maintenance:
- 50 g absolute
- 0.9 x 75 = 67.5 g by weight
- (0.20 x 2765) / 9 = 61.4 g by percentage
Fat target = 68 g (612 kcal)
Carbohydrate - Residual Allocation
Carbs receive the remaining calories after protein and fat are allocated:
carbKcal = targetCalories - proteinKcal - fatKcal
carbGrams = carbKcal / 4
Worked example:
carbKcal = 2765 - 452 - 612 = 1701 kcal
carbGrams = 1701 / 4 = 425 g (5.7 g/kg for 75 kg)
Guardrail ranges by training volume (g/kg):
| Hours/week | Minimum | Maximum |
|---|---|---|
| Under 5 | 3 | 5 |
| 5-10 | 4 | 7 |
| 10-15 | 5 | 9 |
| 15+ | 6 | 12 |
Warnings fire if the calculated carb allocation falls below the minimum for the athlete's training load, or if fat exceeds 1.5 g/kg, or if carbs exceed 12 g/kg.
Safety Guards
The calculator enforces several automatic checks before displaying results:
Weight floor: minimum 40 kg to proceed.
BMI gate: athletes with BMI below 18.5 who select "lose fat" are blocked with an explanation of the hormonal and bone density risks. Athletes with BMI below 16 are blocked entirely and directed to medical care.
Calorie floor: results are blocked if the calculated target falls below 1500 kcal/day (males) or 1200 kcal/day (females). The floor is evaluated before results render.
Deficit warnings (displayed after results):
- Deficit exceeding 500 kcal/day triggers a warning about muscle loss and hormonal disruption risk.
- Athletes training more than 10 hours/week with any deficit exceeding 300 kcal/day receive a specific RED-S risk warning, with a recommendation to periodize nutrition across the training week.
Macro conflict check: if protein and fat minimums combined exceed the target calories, the calculator reports zero carbs and displays an explicit warning that the deficit is too aggressive for the training load.
Why This Matters
Energy balance governs body composition, training adaptation, performance, and physiological health. For endurance athletes, appropriate energy intake supports:
- Training adaptation: adequate energy availability enables mitochondrial biogenesis, capillarization, and metabolic enzyme upregulation.
- Recovery: sufficient calories support glycogen resynthesis, muscle protein synthesis, and immune function.
- Performance: energy deficiency impairs power output, endurance capacity, cognitive function, and decision-making.
- Health: chronic low energy availability causes hormonal disruption, bone density loss, immune suppression, and cardiovascular dysfunction (Relative Energy Deficiency in Sport - RED-S).
Research places the threshold for negative adaptations at energy availability below 30 kcal/kg lean body mass per day. Optimal energy availability is at or above 45 kcal/kg lean body mass per day for males and 40 kcal/kg for females.
Practical Application
Validate Against Real-World Data
Track actual intake and body weight for 2-4 weeks:
- Stable weight = current intake approximately equals TDEE
- Losing 0.5 kg/week = intake is roughly 500 kcal below TDEE
- Gaining 0.5 kg/week = intake is roughly 500 kcal above TDEE
Adjust calculator output based on observed trends.
Monitor and Adjust
Re-evaluate every 2-4 weeks based on:
- Performance metrics (power, pace, recovery quality)
- Body composition changes
- Subjective markers: energy level, sleep quality, mood, menstrual cycle regularity
- Training adaptations
Weight loss rate: exceeding 1% of body weight per week substantially increases risk of muscle loss, performance decline, and hormonal disruption.
Professional Guidance
Seek support from:
- Registered Dietitian or Sports Nutritionist for personalized meal planning
- Exercise Physiologist for integration with training periodization
- Physician for medical monitoring during significant dietary changes
Limitations
- Population equations: Mifflin-St Jeor carries a +/-10% error margin; individual validation against real-world weight trends is required.
- MET estimates: training calorie estimates assume average efficiency; highly trained athletes are more economical and may burn fewer calories than the model predicts.
- Metabolic adaptation: prolonged caloric restriction reduces metabolic rate by 5-15% beyond predicted values (adaptive thermogenesis).
- Body composition: equations use total body weight; lean mass drives BMR more than fat mass, so the model is less accurate at body composition extremes.
- Health conditions: thyroid disorders, PCOS, diabetes, and many medications alter metabolism.
- NEAT variation: daily activity outside training is self-reported and can vary by 500+ kcal/day between individuals.
Use calculator estimates as a starting point, then adjust based on 2-4 weeks of monitored intake and weight trends.
⚠️ HEALTH & SAFETY WARNING
This calculator involves training modifications that can affect your health and performance if misapplied. Consult qualified professionals before making changes.
Medical consultation required if: You have underlying health conditions, are taking medications, pregnant/nursing, under 18, or experience adverse symptoms during training.
ℹ️ IMPORTANT DISCLAIMER
This calculator is for educational purposes only and does NOT constitute medical advice. Consult qualified professionals before making changes. Individual physiology varies. You assume all risk. Must be 18+.
References
-
Mifflin MD, St Jeor ST, Hill LA, et al. A new predictive equation for resting energy expenditure in healthy individuals. Am J Clin Nutr. 1990;51(2):241-247.
-
Ainsworth BE, Haskell WL, Herrmann SD, et al. 2011 Compendium of Physical Activities: a second update of codes and MET values. Med Sci Sports Exerc. 2011;43(8):1575-1581.
-
Thomas DT, Erdman KA, Burke LM. American College of Sports Medicine Joint Position Statement. Nutrition and Athletic Performance. Med Sci Sports Exerc. 2016;48(3):543-568.
-
Phillips SM, Van Loon LJC. Dietary protein for athletes: from requirements to optimum adaptation. J Sports Sci. 2011;29(Suppl 1):S29-S38.
-
Mountjoy M, Sundgot-Borgen JK, Burke LM, et al. IOC consensus statement on relative energy deficiency in sport (RED-S): 2018 update. Br J Sports Med. 2018;52(11):687-697.
-
Burke LM, van Loon LJC, Hawley JA. Postexercise muscle glycogen resynthesis in humans. J Appl Physiol. 2017;122(5):1055-1067.
-
Morton RW, Murphy KT, McKellar SR, et al. A systematic review, meta-analysis and meta-regression of the effect of protein supplementation on resistance training-induced gains in muscle mass and strength in healthy adults. Br J Sports Med. 2018;52(6):376-384.
-
Loucks AB, Kiens B, Wright HH. Energy availability in athletes. J Sports Sci. 2011;29(Suppl 1):S7-S15.
-
Rosenbaum M, Leibel RL. Adaptive thermogenesis in humans. Int J Obes. 2010;34(Suppl 1):S47-S55.
-
Jeukendrup AE. Periodized nutrition for athletes. Sports Med. 2017;47(Suppl 1):51-63.
-
Westerterp KR. Doubly labelled water assessment of energy expenditure: principle, practice, and promise. Eur J Appl Physiol. 2017;117(7):1277-1285.
Scientific Validation Notes
BMR accuracy: The Mifflin-St Jeor equation predicts resting metabolic rate within +/-10% for approximately 82% of individuals. The calculator uses this equation exclusively - the Harris-Benedict equation, while historically common, tends to overestimate BMR by 5-10% in modern populations and is not offered as an option.
MET values: MET values are drawn from the Ainsworth et al. (2011) Compendium of Physical Activities. Net MET (gross minus 1) is used throughout to avoid double-counting resting metabolism that is already captured in BMR.
Protein ranges: The 1.4-2.2 g/kg range reflects the ACSM/AND/DC position stand. The dynamic scaling algorithm targets the upper end of this range for athletes with high training loads, high-intensity work, caloric deficits, or impact-heavy sports - all conditions with published evidence for elevated protein needs.
RED-S threshold: Research establishes energy availability below 30 kcal/kg lean body mass per day as the threshold for hormonal disruption, bone density loss, and immune suppression in both male and female athletes. The calorie floor and deficit warnings are designed to make this risk visible before it becomes a problem.
Individual variation: Metabolic rate varies by +/-300-500 kcal/day between individuals of similar age, sex, and body composition due to genetic factors, NEAT differences, metabolic adaptation, and measurement error. Always validate calculator estimates against real-world data.