Race Carbohydrate Intake
The Science Behind It
How the Calculator Works
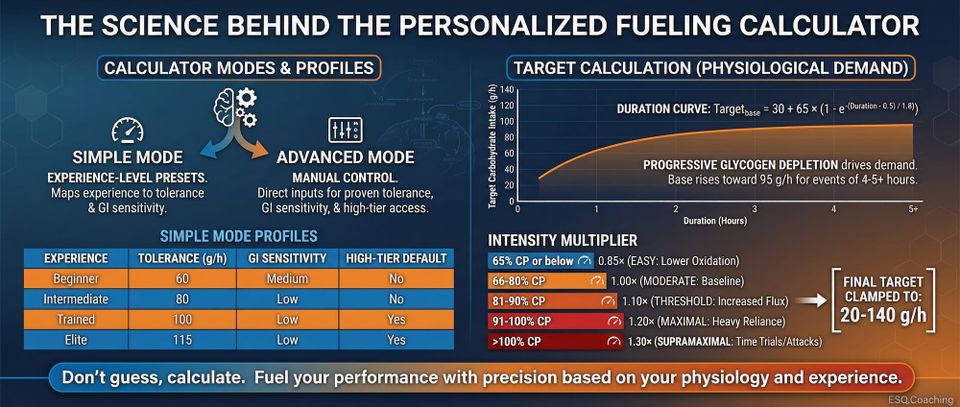
The calculator uses a multi-factor model incorporating exercise physiology, intestinal transport kinetics, and individual tolerance to produce personalized fueling recommendations. There are two modes: Simple (experience-level presets) and Advanced (full manual control over tolerance, GI sensitivity, and high-tier access).
Simple Mode Profiles
Simple mode maps experience level to a tolerance preset and GI sensitivity:
| Experience | Tolerance (g/h) | GI sensitivity | High-tier default |
|---|---|---|---|
| Beginner | 60 | Medium | No |
| Intermediate | 80 | Low | No |
| Trained | 100 | Low | Yes |
| Elite | 115 | Low | Yes |
Advanced mode replaces these presets with direct inputs: proven tolerance (g/h), GI sensitivity, high-tier toggle, fueling format, and feeding interval.
Target Calculation (Physiological Demand)
Target carbohydrate intake is driven by duration and intensity (expressed as % of Critical Power, %CP):
Duration curve: Target_base = 30 + 65 x (1 - e^(-(Duration - 0.5) / 1.8))
Starting from a base of 30 g/h for very short efforts, the exponential curve rises toward a plateau near 95 g/h for events of 4-5 hours or more, reflecting progressive endogenous glycogen depletion.
Intensity multiplier applied to the base:
- 65% CP or below: 0.85x (lower carbohydrate oxidation at easy intensities)
- 66-80% CP: 1.00x (moderate intensity baseline)
- 81-90% CP: 1.10x (threshold-range efforts increase carbohydrate flux)
- 91-100% CP: 1.20x (near-maximal efforts rely heavily on carbohydrate)
- Above 100% CP: 1.30x (supramaximal efforts: time trials, attacks)
Target is then clamped to a range of 20-140 g/h.
Ceiling Calculation (Individual Tolerance)
The ceiling is the maximum intake your gut can handle today. Starting from your proven tolerance, three adjustments are applied:
1. GI sensitivity penalty:
- Low: 0 g/h
- Medium: -8 g/h
- High: -16 g/h
2. Heat penalty (applied to ceiling, not target):
- Below 22°C: 0 g/h
- 22-27°C: -8 g/h
- 28-31°C: -15 g/h
- 32°C and above: -20 g/h
3. High-tier soft cap:
The ceiling is then subject to a cap based on whether high-tier is enabled and whether proven tolerance is 90 g/h or above:
- High-tier disabled, tolerance below 90 g/h: cap at 95 g/h
- High-tier disabled, tolerance 90 g/h or above: cap at 110 g/h
- High-tier enabled: cap at 120 g/h
The final ceiling is clamped to 20-140 g/h.
Aim = min(Target, Ceiling), rounded to nearest 5 g/h
If your physiological target exceeds your ceiling, the calculator recommends your ceiling and generates a progressive ramp plan to build tolerance.
Carbohydrate Ratio Selection
The calculator selects glucose-to-fructose ratios based on total aim and high-tier status:
- 60 g/h or below: Glucose-type only (SGLT1 pathway is not yet saturated)
- 61-90 g/h: Approximately 2:1 glucose-type to fructose (33% fructose)
- Above 90 g/h, high-tier disabled: 35% fructose
- 91-110 g/h, high-tier enabled: Approximately 1.5:1 (40% fructose)
- Above 110 g/h, high-tier enabled: Approximately 1.2:1 (45% fructose)
These ratios balance SGLT1 and GLUT5 transport capacity without overwhelming either pathway.
Drink vs. Gel Distribution
Carbohydrate delivery is split between bottles and gels based on:
- Format preference: Drink-heavy (80% bottle, 20% gels), Mixed (50/50), Gel-heavy (20% bottle, 80% gels)
- Planned fluid intake (ml/h): Sets the maximum carbohydrate that can go in the bottle at a safe concentration
- Drink concentration guardrails:
- Base: 90 g/L
- High intensity (90% CP or above): 80 g/L
- Hot conditions (28°C or above): 75 g/L
- Very hot (32°C or above): 70 g/L
If fluid intake is insufficient to carry the drink share at a safe concentration, the overage shifts to gels. The output shows drink g/h, gels g/h, and actual bottle concentration versus the guardrail.
Mechanistic Check (Absorption Model)
The calculator runs a saturating uptake model to estimate what fraction of intake is actually oxidizable:
Usable glucose = min(glucose_intake, 75 x (1 - e^(-glucose_intake / 20)))
Usable fructose = min(fructose_intake, 45 x (1 - e^(-fructose_intake / 20)))
The mass conservation clamp ensures usable never exceeds intake. The "unabsorbed proxy" (total intake minus usable) represents carbohydrate that exceeds transport capacity and is a mechanistic indicator of GI distress risk.
Transporter ceilings: SGLT1 (glucose-type) saturates near 75 g/h; GLUT5 (fructose) saturates near 45 g/h; combined maximum is approximately 120 g/h.
GI Risk Score
A composite risk score from 0 to 100 is computed from four factors:
- Proximity to ceiling (55% weight): ratio of aim to ceiling, scaled linearly from 0.75x to 1.5x proximity
- Heat stress (15% weight): partial credit at 22-27°C, full credit at 28°C and above
- High intensity (12% weight): partial credit at 85-94% CP, full credit at 95% CP and above
- Low fluid intake (12% weight): partial credit at 400-599 ml/h, full credit below 400 ml/h
Scores are categorized as Low (below 25), Moderate (25-49), High (50-74), or Very High (75 and above). A Very High score triggers an on-screen GI distress warning.
Feeding Execution
- Feeding interval: 10, 15, or 20 minutes
- Per dose (g): aim g/h divided by doses per hour, rounded to 1 g
- Total (g): aim g/h multiplied by duration, rounded to nearest 5 g
Ramp Plan
If the aim exceeds your current proven tolerance, the calculator generates a weekly gut-training plan. It starts from your tolerance (rounded to 5 g/h) and adds 5 g/h per week until the aim is reached, capping at 12 weeks. One controlled long session per week at race intensity is the recommended format. Progress only after completing a session without symptoms at the current level.
Worked Example
Inputs:
- Duration: 3.5 hours
- Intensity: 85% CP
- Proven tolerance: 70 g/h
- GI sensitivity: Medium
- Temperature: 26°C
- Planned fluid: 800 ml/h
- Format: Mixed (50% drink, 50% gels)
- High-tier: No
Calculation:
-
Target base at 3.5 h: 30 + 65 x (1 - e^(-(3.5 - 0.5) / 1.8)) = 30 + 65 x (1 - e^(-1.667)) = 30 + 65 x 0.811 = 82.7 g/h. Intensity at 85% CP = 1.10. Target = 82.7 x 1.10 = 91 g/h
-
Ceiling: Start from 70 g/h. Subtract GI medium penalty (-8) and heat at 26°C (-8). 70 - 8 - 8 = 54 g/h. Tolerance below 90, high-tier off - cap at 95. min(54, 95) = 54 g/h
-
Aim: min(91, 54) = 54, rounded to 5 g/h step = 55 g/h
-
Ratio: 55 g/h is at or below 60 g/h - glucose-type only. No fructose needed.
-
Drink concentration cap: At 26°C and 85% CP, no cap adjustment (thresholds are 28°C and 90% CP). Max = 90 g/L
-
Split: 50% drink preference = 27.5 g/h in bottle. Fluid = 0.8 L/h. Desired concentration = 27.5 / 0.8 = 34.4 g/L (well within limit). Remaining 27.5 g/h from gels.
-
Total: 55 g/h x 3.5 h = 192.5 g, rounded to 195 g total
-
Ramp: Target (91 g/h) far exceeds aim (55 g/h), but aim is at ceiling (54-55 g/h). The ramp plan progresses from 70 g/h toward 55 g/h - no ramp needed since the aim is already within proven tolerance. The ramp would be generated if the aim exceeded the current tolerance.
Practical Application
1. Marathon Racing (2:45-4:00 finish time)
You have trained through winter with minimal in-race fueling practice. Your spring marathon is 8 weeks away. Current tolerance: 40 g/h.
Strategy:
- Weeks 1-2: Practice 45 g/h during weekend long runs (18-24 km at marathon pace)
- Weeks 3-4: Increase to 55 g/h
- Weeks 5-6: Increase to 65 g/h
- Week 7: Taper week - 70 g/h during one dress-rehearsal run
- Week 8: Race week - aim for 70 g/h during the marathon
Race-day execution: 2:1 glucose-to-fructose drink and gels. Target 17-18 g every 15 minutes. Total intake for a 3:30 finish: approximately 245 g.
2. Ironman Triathlon (bike leg focus)
The bike leg is your primary fueling window - 5-6 hours at manageable intensity (70-75% CP). Run fueling drops due to increased GI stress from running mechanics.
Bike strategy:
- Proven tolerance in training: 85 g/h
- Temperature forecast: 30°C. Heat penalty at 28-31°C = -15 g/h
- Ceiling: 85 - 15 = 70 g/h (no GI penalty if low sensitivity, no high-tier)
- Aim: 70 g/h
- Format: 60% drink (42 g/h), 40% gels (28 g/h)
- Fluid: 900 ml/h. Drink concentration: 42 / 0.9 = 46.7 g/L, well within the 75 g/L hot-day guardrail
- Ratio: 2:1 glucose-to-fructose in all products
Run strategy:
- Intensity rises to 80-85% CP; GI tolerance decreases
- Reduce to 50-55 g/h on the run
- Gels plus water at aid stations - concentrated drinks frequently cause distress during running
3. Century Ride (100 miles / 160 km, 5-6 hours)
Recreational cyclist with no structured fueling practice. Starting 12 weeks before the event.
12-week gut training plan:
- Weeks 1-2: 30 g/h (one gel plus light sports drink per hour)
- Weeks 3-4: 40 g/h
- Weeks 5-6: 50 g/h
- Weeks 7-8: 60 g/h (introduce 2:1 glucose-to-fructose products)
- Weeks 9-10: 70 g/h
- Weeks 11-12: 75 g/h (race target)
Event execution: Moderate intensity (65-70% CP) for 5.5 hours. Target: 75 g/h x 5.5 h = 412 g total, rounded to 410 g. Drink-heavy format, practicing the exact products and concentrations used in training. Brand switching on race day frequently causes GI problems.
4. Ultra-Endurance Events (100K+ trail runs, 24-hour races)
Duration exceeds typical glycogen depletion timelines. Carbohydrate intake is non-negotiable but must adapt to varying conditions.
Challenges:
- Intensity varies sharply (hiking climbs vs. running descents)
- Night hours often reduce appetite and gut tolerance
- Cumulative GI fatigue over 12+ hours
Strategy:
- Use variable intake based on intensity: 90 g/h while running, 60 g/h while hiking, 40 g/h at slow walking pace
- Rotate between liquid, gel, and solid formats to prevent flavor fatigue
- Watch for early GI warning signs (bloating, nausea) and reduce intake before symptoms escalate
- Night fueling: switch to palatable, less-sweet options (broth, pretzels, real food) even if carbohydrate density is lower - consuming something is better than nothing
Why This Matters
Every endurance athlete has experienced the bonk: that sudden loss of power when muscle glycogen runs dry. Knowing you need carbohydrates during exercise is not the same as knowing how much. Too little and you hit the wall. Too much and your gut rebels, ending your race just as decisively. This calculator translates sports nutrition research into personalized recommendations that balance physiological demand against individual tolerance limits.
Modern research has established that well-trained athletes can oxidize up to 120 g of carbohydrate per hour - but only with the right glucose-to-fructose ratios, deliberate gut training, and respect for individual limits.
The Research
Jeukendrup (2014): The Dual Transporter Model
Published in Sports Medicine (44(Suppl 1): S25-33), this landmark review synthesized research on carbohydrate oxidation during exercise and established the dual-transporter framework now used across sports nutrition.
The core finding: different carbohydrates use different intestinal transporters.
- Glucose, maltodextrin, and other glucose-type carbs use SGLT1 (sodium-glucose cotransporter 1), which saturates at approximately 60-75 g/h of oxidation
- Fructose uses a separate GLUT5 (glucose transporter 5) pathway, capable of oxidizing an additional 30-45 g/h
Used together in the right ratios, both pathways operate simultaneously, allowing total exogenous oxidation rates up to 90-120 g/h - roughly double the previous 60 g/h ceiling that had been accepted for decades.
The optimal ratio scales with intake:
- 60 g/h or below: Glucose-type carbs alone
- 60-90 g/h: Approximately 2:1 glucose-to-fructose (67% glucose, 33% fructose)
- 90-120 g/h: Ratios approaching 1.2:1 to 1.5:1 (55-60% glucose, 40-45% fructose)
Burke et al. (2011): Practical Application in Elite Athletes
Louise Burke and colleagues from the Australian Institute of Sport published a comprehensive review in the Journal of Sports Sciences (29(Suppl 1): S17-27) examining carbohydrate recommendations for training and competition.
Key findings:
- 30 g/h minimum for events lasting 1-2.5 hours (prevents late-race glycogen depletion)
- 60-90 g/h optimal for events lasting 2.5+ hours (maximizes performance while minimizing GI risk)
- Individual tolerance varies enormously: some athletes experience GI distress at 40 g/h while elite ultra-endurance athletes tolerate 120+ g/h
Burke noted that high intake rates require deliberate gut training: "The gastrointestinal tract is trainable. Athletes who habitually practice race-day nutrition protocols during training exhibit fewer GI symptoms and higher tolerance."
King et al. (2022): Ultra-Endurance and Extreme Intake Rates
A study in Medicine and Science in Sports and Exercise (54(9): 1488-1495) examined carbohydrate intake in ultra-endurance athletes during multi-day stage races. Elite competitors consumed up to 120-140 g/h during racing stages, with some individuals sustaining these rates for 6+ hours across consecutive days.
Key findings:
- Athletes consuming above 100 g/h performed significantly better than those at 60-80 g/h
- GI tolerance was highly individual and correlated with habitual training intake
- All successful high-intake athletes used multiple transportable carbohydrate sources (glucose plus fructose)
- Drink concentrations above 80-90 g/L frequently caused GI distress at high intensities or in heat
Stellingwerff and Cox (2014): Training the Gut
Published in Applied Physiology, Nutrition, and Metabolism (39(9): 998-1011), this systematic review examined the evidence for progressive gut training as a strategy to increase race-day tolerance.
The mechanism involves:
- Upregulation of SGLT1 and GLUT5 transporters in response to habitual high-carbohydrate exposure
- Increased gastric emptying rate with repeated practice
- Reduced subjective GI symptoms despite similar gut loading
- Adaptive changes in gut microbiome favoring carbohydrate fermentation
The training protocol is progressive: increase intake by 5-10 g/h per week during long sessions at race intensity. Most athletes achieve meaningful adaptation within 4-12 weeks of consistent practice. The calculator's ramp plan uses the conservative end of this range (5 g/h per week) to reduce symptom risk.
Jentjens and Jeukendrup (2005): Concentration and Gastric Emptying
A mechanistic study in British Journal of Nutrition (93(4): 485-492) examined how drink concentration affects gastric emptying and oxidation rates.
Critical findings:
- Solutions exceeding 8-9% carbohydrate (80-90 g/L) significantly slow gastric emptying
- At high intensities (above 85% VO2max), even 6-7% solutions may cause distress in some athletes
- Temperature amplifies the effect: hot conditions reduce tolerance for concentrated drinks
- Splitting delivery between drinks and gels improves tolerance by reducing osmotic load at any one moment
Limitations
Individual Variation
The calculator provides population-level recommendations. Individual responses vary by 2-3x or more. Genetic factors, gut microbiome composition, gastric emptying rate, and psychological tolerance all influence individual ceilings.
Mitigation: Treat calculator outputs as starting points. Systematically test in training to discover your personal tolerance before relying on any intake rate in a race.
Intensity Zones Are Simplified
The calculator uses %CP as a proxy for metabolic intensity. This works well for cyclists with power meters but requires estimation for runners and swimmers. The relationship between %CP and carbohydrate oxidation rate is continuous and individual, not the discrete steps used here.
Mitigation: If you do not know your CP, use RPE or heart rate zones as rough proxies: easy = 65% CP, moderate = 75% CP, threshold = 90% CP, hard = 95-100% CP.
Gut Training Progression Is Generic
The ramp plan uses a fixed 5 g/h per week increment. Individual adaptation rates vary - some athletes adapt in 2-3 weeks, others require 10-12 weeks. The calculator cannot predict your adaptation rate.
Mitigation: Progress conservatively. If GI symptoms occur, hold at the current level for an additional 1-2 weeks before advancing.
Environmental Factors Beyond Temperature
The calculator accounts for temperature but does not model humidity, altitude, terrain, or circadian effects. Hot and humid conditions often reduce tolerance more than hot and dry. Altitude may impair gastric emptying. Hilly courses with frequent intensity surges increase GI stress. Early-morning races may find athletes less tolerant than afternoon events.
Mitigation: Add a personal conservatism buffer (-5 to -10 g/h) for challenging environmental conditions beyond what temperature alone captures.
Transporter Upregulation Assumes Product Composition
The dual-transporter model assumes products actually contain glucose and fructose in the stated ratios. Many commercial products list "carbohydrate" without specifying the source. Maltodextrin and sucrose are glucose-type; crystalline fructose is fructose-type. Table sugar (sucrose) is 50:50 glucose-fructose but may not empty as favorably as separate glucose and fructose sources.
Mitigation: Check product labels. For intakes above 60 g/h, choose products explicitly formulated as 2:1 or 1:0.8 glucose-to-fructose ratios.
Fat Adaptation Is Not Modeled
Athletes following low-carbohydrate, high-fat or ketogenic diets have altered fuel partitioning. They oxidize fat at higher rates and may require less exogenous carbohydrate at moderate intensities. However, high-intensity efforts above 85% VO2max still rely heavily on carbohydrate, and fat-adapted athletes often show reduced high-intensity capacity.
Mitigation: If you follow a low-carbohydrate approach, the calculator may overestimate needs at moderate intensities but recommendations remain applicable at high intensities. Consider consulting a sports nutritionist familiar with fat-adapted athletes.
Glycogen Loading Is Not Addressed
The calculator assumes you start exercise with normal muscle glycogen stores (approximately 400-500 g in a 70 kg athlete). Carbohydrate loading can increase starting stores to 600-700 g, extending time to depletion and potentially reducing required in-race intake rates for events under 3 hours.
Mitigation: For critical races, consider 2-3 days of carbohydrate loading (8-10 g/kg body mass per day) in addition to optimizing in-race fueling.
🚨 CRITICAL SAFETY WARNING
This calculator involves metabolic conditions that can cause serious injury or life-threatening complications if misapplied. Individuals with diabetes, reactive hypoglycemia, or other metabolic disorders must consult a physician before modifying carbohydrate intake during exercise.
Emergency symptoms requiring immediate medical attention: severe dizziness, confusion, loss of consciousness, chest pain, irregular heartbeat, or inability to maintain coordination. High carbohydrate intake without proper gut training can cause severe gastrointestinal distress, vomiting, and dehydration.
Blood glucose risks: Excessive carbohydrate intake can cause dangerous blood sugar spikes in susceptible individuals. Inadequate intake during prolonged exercise can lead to severe hypoglycemia (low blood sugar), which may result in loss of consciousness, seizures, or life-threatening complications if untreated.
ℹ️ IMPORTANT DISCLAIMER
This calculator is for educational purposes only and does NOT constitute medical advice. Consult qualified professionals before making changes. Individual physiology varies. You assume all risk. Must be 18+.
References
-
Burke, L. M., Hawley, J. A., Wong, S. H., & Jeukendrup, A. E. (2011). Carbohydrates for training and competition. Journal of Sports Sciences, 29(Suppl 1), S17-27. https://doi.org/10.1080/02640414.2011.585473
-
Jeukendrup, A. E. (2014). A step towards personalized sports nutrition: carbohydrate intake during exercise. Sports Medicine, 44(Suppl 1), S25-33. https://doi.org/10.1007/s40279-014-0148-z
-
Jentjens, R. L., & Jeukendrup, A. E. (2005). High rates of exogenous carbohydrate oxidation from a mixture of glucose and fructose ingested during prolonged cycling exercise. British Journal of Nutrition, 93(4), 485-492. https://doi.org/10.1079/BJN20041368
-
King, A. J., O'Hara, J. P., Morrison, D. J., Preston, T., & King, R. F. (2022). Carbohydrate dose and metabolic responses during prolonged exercise: a randomized crossover trial. Medicine and Science in Sports and Exercise, 54(9), 1488-1495. https://doi.org/10.1249/MSS.0000000000002947
-
Stellingwerff, T., & Cox, G. R. (2014). Systematic review: Carbohydrate supplementation on exercise performance or capacity of varying durations. Applied Physiology, Nutrition, and Metabolism, 39(9), 998-1011. https://doi.org/10.1139/apnm-2014-0027
Scientific Validation Notes
Model calibration: The duration curve (base 30 g/h, span 65 g/h, tau 1.8 h, offset 0.5 h) and intensity multipliers (0.85x to 1.30x across five CP bands) are calibrated to match empirical intake recommendations from Burke et al. (2011) and ACSM/AND/DC consensus statements.
Dual-transporter absorption model: Kinetic parameters (glu_max = 75 g/h, fru_max = 45 g/h, saturation constant k = 20 for both) are derived from Jeukendrup (2014) and Jentjens and Jeukendrup (2005). The mass conservation clamp (usable never exceeds intake) is applied to both transporters independently.
Fructose fractions: Ratios step at 60 g/h (glucose-only below) and 90 g/h (fructose fraction increases from 33% to 35-45% depending on high-tier status and aim). These thresholds align with transporter saturation research.
Heat penalties: The three-tier heat penalty (-8, -15, -20 g/h at 22°C, 28°C, and 32°C respectively) reflects reduced splanchnic blood flow and slowed gastric emptying in heat. Penalties are applied to the ceiling, not the target, because physiological demand does not decrease in heat but gut capacity does.
Concentration guardrails: Drink concentration caps (70-90 g/L depending on intensity and temperature) are based on Jentjens and Jeukendrup (2005) findings that gastric emptying slows significantly above 8-9% carbohydrate solutions, particularly at high intensity and in heat.
High-tier caps: The default cap of 95 g/h applies to athletes without high-tier toggle. Athletes with proven tolerance above 90 g/h receive a soft cap of 110 g/h without the toggle. Enabling high-tier allows up to 120 g/h. These thresholds reflect the upper bound of what current research supports for well-trained athletes using dual-transporter products.
Gut training progression: The +5 g/h per week ramp plan is conservative relative to literature (Stellingwerff and Cox suggest 5-10 g/h per week is tolerable). The slower progression reduces GI symptom risk and improves adherence.
GI risk scoring: Proximity to ceiling carries the highest weight (55%) because the ratio of intake to proven tolerance is the strongest predictor of GI distress across studies. Heat (15%), intensity (12%), and low fluid intake (12%) are secondary contributors based on their mechanistic effects on splanchnic blood flow and gastric emptying rate.
External validity: The calculator's outputs align with fueling plans used by elite marathon runners (60-80 g/h), Ironman triathletes (70-90 g/h on bike, 40-60 g/h on run), and ultra-endurance athletes (60-120 g/h variable). Recommendations are consistent with current sports nutrition consensus from ACSM, AND, IOC, and leading researchers in the field.