Critical Power, Critical Velocity, and Critical Swim Speed
How the Calculator Works
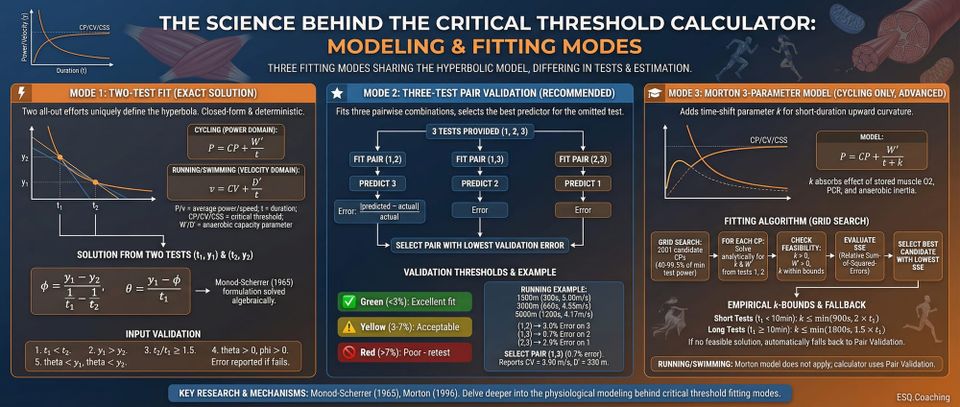
The calculator implements three fitting modes. All three share the same underlying hyperbolic model; they differ in how many tests you provide and how the parameters are estimated.
Mode 1: Two-Test Fit (Exact Solution)
Two all-out efforts at different durations uniquely define the hyperbola. The solution is closed-form and deterministic.
Model equations:
Cycling (power domain):
P = CP + W' / t
Running and swimming (velocity domain):
v = CV + D' / t
Where:
- P = average power (W), v = average speed (m/s)
- t = duration (seconds)
- CP / CV / CSS = critical threshold (the horizontal asymptote)
- W' / D' = anaerobic capacity parameter
Solution from two tests (t1, y1) and (t2, y2):
phi = (y1 - y2) / (1/t1 - 1/t2)
theta = y1 - phi / t1
This is the Monod-Scherrer (1965) formulation solved algebraically. Two points, one unique solution.
Input validation:
- Test 1 duration must be shorter than Test 2
- Test 1 power/speed must exceed Test 2 (shorter effort = higher output)
- Duration ratio must be at least 1.5:1
- Calculated theta and phi must both be positive
- theta must be less than both test values
If any check fails, the calculator reports an error before proceeding.
Mode 2: Three-Test Pair Validation (Recommended)
Provide three tests. The calculator fits all three pairwise combinations of two, then selects the pair that best predicts the third.
Algorithm:
- Compute three 2-point fits: tests 1+2 (validate on 3), tests 1+3 (validate on 2), tests 2+3 (validate on 1)
- For each fit, compute the prediction error on the omitted test: error = |predicted - actual| / actual
- Select the pair with the lowest validation error
- Report the validation error as a quality indicator
Validation thresholds used by the calculator:
- Under 3% error: excellent fit
- 3-7% error: acceptable
- Over 7%: poor - consider retesting with better pacing
Why pair validation works: A test that was poorly executed (bad pacing, fatigue, wind) will produce a large prediction error when included in a fit and a small error when excluded. The algorithm naturally identifies and drops the outlier without requiring you to know which test was the problem.
Example - three running time trials:
- 1500m in 5:00 (300 s) - 5.00 m/s
- 3000m in 11:00 (660 s) - 4.55 m/s
- 5000m in 20:00 (1200 s) - 4.17 m/s
The three pair fits produce validation errors of 0.7%, 2.9%, and 3.0%. The calculator selects the 1500m + 5000m pair (0.7% error) and reports CV = 3.90 m/s, D' = 330 m.
Mode 3: Morton 3-Parameter Model (Cycling Only, Advanced)
Adds a time-shift parameter k to account for upward curvature at short durations caused by muscle oxygen stores and anaerobic inertia.
Model:
P = CP + W' / (t + k)
The standard 2-parameter model under-predicts performance for efforts under 2-3 minutes because phosphocreatine, stored muscle oxygen, and fast anaerobic pathways contribute substantially at short durations. The k parameter absorbs this effect.
Fitting algorithm:
The calculator uses a grid search over 2001 candidate CP values between 40% and 99.5% of the minimum test power. For each candidate CP:
- Solve analytically for k and W' from tests 1 and 2 (sorted by duration)
- Check feasibility: k > 0, W' > 0, k within the empirical bounds described below
- Evaluate relative sum-of-squared-errors (SSE) across all three tests
- Keep the feasible candidate with the lowest SSE
The k parameter is bounded by empirical guardrails to prevent overfitting:
- Short tests (Test 1 under 10 minutes): k limited to min(900 s, 2 × t1)
- Long tests (Test 1 at or over 10 minutes): k limited to min(1800 s, 1.5 × t1)
These bounds are not from Morton's original formulation. They are practical constraints added to prevent runaway k values when test spacing is suboptimal.
If the grid search finds no feasible solution, the calculator falls back to three-test pair validation automatically.
Running and swimming: The Morton model does not apply. The distance-based equivalence d = theta × t + phi requires the 2-parameter form; adding a time shift breaks the algebraic relationship. When Morton mode is selected for running or swimming, the calculator uses pair validation instead.
Pacing Calculator
After calculating CP/CV/CSS, a pacing panel appears below the results.
Cycling: Enter a target duration to estimate average power, or enter a target power to estimate how long you can hold it. The power-to-duration inversion for the Morton model is: t = W' / (P - CP) - k.
Running: Enter a race distance to predict time (using d = CV * t + D'), or enter a target pace to estimate the maximum distance you can sustain at that pace.
Swimming: Same structure as running - predict time for a distance, or estimate maximum distance at a target pace.
Race time formula (running/swimming):
time = (distance - D') / CV
This applies when distance exceeds D'. For distances within D', the formula does not apply since the entire distance could theoretically be covered using only the anaerobic capacity.
Worked Examples
Running: 2-Test Mode
Runner planning marathon training.
Tests:
- 1600m in 5:20 (320 s) - 1600/320 = 5.00 m/s
- 5000m in 18:45 (1125 s) - 5000/1125 = 4.44 m/s
Calculation:
phi = (5.00 - 4.44) / (1/320 - 1/1125)
phi = 0.56 / 0.002234
phi = 250.7 m (D')
theta = 5.00 - 250.7 / 320
theta = 5.00 - 0.783
theta = 4.22 m/s (CV = 3:57/km)
Interpretation:
- CV of 4.22 m/s represents the boundary between aerobic-dominant and anaerobically-limited running - roughly half-marathon to marathon race pace range
- D' of 251 m is the anaerobic distance reserve available for surges or running above CV
- Running at 4.44 m/s (the 5K pace) draws on D' at 4.44 - 4.22 = 0.22 m/s - meaning 251 m / 0.22 m/s = ~19 minutes until D' is exhausted at that pace
Swimming: 2-Test Mode
Competitive swimmer determining training paces.
Tests:
- 200m in 2:25.0 (145 s) - 200/145 = 1.379 m/s
- 400m in 5:10.0 (310 s) - 400/310 = 1.290 m/s
Calculation:
phi = (1.379 - 1.290) / (1/145 - 1/310)
phi = 0.089 / 0.00368
phi = 24.2 m (D')
theta = 1.379 - 24.2 / 145
theta = 1.379 - 0.167
theta = 1.212 m/s (CSS = 1:22.3/100m)
Interpretation:
- CSS of 1.21 m/s is the sustainable threshold pace, corresponding roughly to 400-800m race pace
- D' of 24 m is the anaerobic swimming capacity available for sprints and finishing kicks
- Threshold training sets: 6 x 400m at CSS (1:22-1:23/100m) with 30-45 s rest
Cycling: Morton 3-Parameter Mode
Cyclist with three tests spanning short to long durations.
Tests:
- 5 min at 350 W
- 12 min at 305 W
- 25 min at 275 W
The Morton model fits a curved hyperbola that accounts for the elevated 5-minute power relative to a simple 2-point fit. The k parameter (for example, k = 120 s) compresses the effective duration: a 5-minute effort becomes equivalent to a 7-minute effort in terms of capacity depletion. CP and W' are jointly estimated to minimize error across all three points.
If RMS error is under 3%, the fit is excellent. If over 7%, reconsider test execution.
Practical Application
Marathon Pace Planning (Running CV)
From a 3-test protocol: CV = 4.35 m/s (3:50/km), D' = 430 m.
Race pace targets:
- Marathon (42K): start 95% CV (4:02/km) for the first 30K, build to CV pace for the final 12K
- Half marathon: 102-103% CV (3:44-3:47/km) is sustainable for 90-110 minutes
- 10K: 105-107% CV (3:35-3:38/km) - uses D' progressively, sustainable for 35-40 minutes
Training zones:
- Easy: 75-82% CV (4:41-5:07/km)
- Tempo/threshold: 95-100% CV (3:50-4:02/km)
- Intervals: 105-110% CV (3:30-3:40/km), limited by D' depletion
Triathlon Swim Pacing (CSS)
Olympic distance (1500m swim): CSS = 1.30 m/s (1:17/100m), D' = 28 m.
Race strategy:
- Pool-equivalent pace (CSS): 1500 / 1.30 = 1154 s = 19:14
- Open water adjustment for sighting and congestion: target 95% CSS = 1.235 m/s (1:21/100m) - estimated 20:13 finish
- Opening 200m at 1.35 m/s to establish position uses ~10 m of D', leaving 18 m in reserve
- Hold 1.235 m/s for middle 1100m
- Use remaining D' to lift pace over the final 200m
Cycling Interval Training (Critical Power)
CP = 280 W, W' = 18 kJ.
W' depletion at constant power above CP:
- 320 W (CP + 40 W): depletion rate 40 J/s - time to exhaustion 450 s (7:30)
- 350 W (CP + 70 W): depletion rate 70 J/s - time to exhaustion 257 s (4:17)
- 400 W (CP + 120 W): depletion rate 120 J/s - time to exhaustion 150 s (2:30)
Session design:
- Sweet spot: 5 x 20 min at 265 W (95% CP), 5 min recovery - minimal W' depletion
- Threshold: 3 x 10 min at 285-290 W (102-104% CP), 5 min recovery - progressive depletion, partial recovery
- VO2max intervals: 5 x 5 min at 320 W (114% CP), 5 min recovery - each rep uses ~12 kJ of W' (67%), partial recovery between reps
Track Running: 1500m vs. 5000m
CV = 5.10 m/s (3:16/km), D' = 290 m.
1500m at 5.70 m/s (2:37/km):
- Predicted time: 1500 / 5.70 = 263 s (4:23)
- D' usage: (5.70 - 5.10) × 263 = 158 m (54% of D') - sustainable
5000m at 5.30 m/s (3:09/km):
- Predicted time: (5000 - 290) / 5.10 = 923 s (15:23)
- D' usage: (5.30 - 5.10) × 923 = 185 m (64% of D') - aggressive but feasible
A more conservative 5000m at 5.22 m/s (3:12/km) uses ~140 m of D' (48%), providing more margin.
Why This Matters
The hyperbolic power-duration model applies equally to cycling, running, and swimming. The threshold parameter - CP, CV, or CSS depending on sport - marks the boundary between efforts that can be sustained indefinitely (in theory) and efforts that exhaust a finite capacity and lead to task failure. Training above this threshold without adequate recovery depletes W'/D'. Training at or just below it provides the highest aerobic stimulus while remaining sustainable.
Understanding your personal CP/CV/CSS allows evidence-based decisions about race pacing, interval design, and training zone boundaries. This calculator provides three fitting modes with increasing robustness: exact 2-point solution, 3-point pair validation (recommended for field testing), and Morton's 3-parameter extension for cyclists with short-duration data.
The Research
Monod and Scherrer (1965): The Foundational Model
Henri Monod and Jean Scherrer introduced the critical power concept in the Journal de Physiologie (57: 1-2), working from isolated muscle preparations and whole-body cycling exercise. They observed that work performed to exhaustion followed a linear relationship with time:
W = CP × t + W'
Where W is total work (joules), CP is critical power (watts), and W' is the finite work capacity above CP (joules). Rearranged to average power:
P = CP + W' / t
This is the model implemented in all three modes of this calculator (for cycling). The model predicts that at powers above CP, exhaustion occurs when W' is fully depleted. At or below CP, exercise is theoretically sustainable.
Hill (1993): Critical Velocity in Running
David Hill adapted the Monod-Scherrer framework to running in the Journal of Sports Sciences (11(3): 217-233). Since running performance is described in terms of distance and time rather than power and work, Hill reformulated:
d = CV × t + D'
Rearranged: v = CV + D' / t
Where d is distance (meters), CV is critical velocity (m/s), and D' is finite distance capacity above CV (meters). Hill demonstrated that CV estimated from two or more time trials corresponds closely to the lactate threshold and maximal lactate steady state, aligning with 10K to half-marathon race pace for trained runners.
Wakayoshi et al. (1992): Critical Swim Speed
Wakayoshi and colleagues applied the same framework to swimming in Medicine and Science in Sports and Exercise (24(2): 237-242). They tested competitive swimmers at distances from 50m to 400m and found the distance-time relationship followed the hyperbolic model:
d = CSS × t + D'
CSS was validated against blood lactate measurements and shown to approximate 400m race pace or slightly faster - the highest sustainable swimming intensity. Two tests (short and long, for example 200m and 400m) are sufficient for reliable estimation.
Poole et al. (2016): Physiological Underpinnings
A comprehensive review in Medicine and Science in Sports and Exercise (48(8): 1563-1576) synthesized 50+ years of CP research. Key findings:
- CP/CV corresponds to the highest intensity at which VO2 stabilizes. Exercise at CP elicits a VO2 that may approach but does not exceed VO2max, and can be sustained for 30-60+ minutes in trained athletes.
- W'/D' depletion is approximately proportional to power/speed excess above CP/CV. The depletion rate is approximately linear.
- Recovery is slower than depletion. Full W'/D' recovery after complete depletion can require 10-20+ minutes.
- CP/CV falls slightly above the lactate threshold and close to MLSS. The alignment varies by sport and individual training background.
Jones et al. (2010) and the Morton 3-Parameter Model
Jones, Vanhatalo, Burnley, Morton, and Poole reviewed CP implications for VO2max determination and exercise tolerance in Medicine and Science in Sports and Exercise (42(10): 1876-1890). Morton's 3-parameter extension - P = CP + W'/(t + k) - was described as improving fit for very short durations. The k parameter captures anaerobic inertia (muscle oxygen stores, fast phosphocreatine kinetics) that causes performance at 1-3 minutes to exceed simple hyperbolic prediction.
This calculator implements the Morton model via grid search: 2001 CP candidates are evaluated, with k and W' solved analytically from two test points for each candidate, and SSE minimized across all three tests.
Test Protocol Requirements
The 1.5:1 minimum duration ratio is grounded in error propagation. As test durations converge, the denominator (1/t1 - 1/t2) approaches zero, amplifying measurement noise into large parameter errors. Ratios below 1.5:1 produce standard errors exceeding 10% even with precise test execution. Optimal test spacing for 2-parameter fits: short duration of 3-8 minutes paired with long duration of 12-25 minutes for cycling; 1500m paired with 5000m for running; 200m paired with 400m for swimming.
Limitations
The Model Assumes a Perfect Hyperbola
The equation y = theta + phi/t is an idealization. In practice:
- Under 2 minutes: Muscle oxygen stores, phosphocreatine, and anaerobic inertia create upward curvature - actual performance exceeds hyperbolic prediction. The Morton k parameter partially corrects for this.
- Over 60 minutes: Glycogen depletion, thermoregulation, and central fatigue create downward curvature - actual performance falls below hyperbolic prediction. CV/CSS derived from sub-20-minute tests should not be extrapolated to multi-hour efforts.
Use test durations appropriate to the target application. For marathon training, use 3K + 8K or 5K + 10K tests. For sprint triathlon swimming, use 200m + 400m tests.
W'/D' is Not a Fixed Fuel Tank
The model treats W'/D' as a constant capacity that depletes at a rate proportional to power/speed excess above CP/CV. Research by Skiba et al. (2012) shows recovery is exponential with a time constant of 300-600 seconds, and recovery after a hard interval is typically 70-85% complete during a standard rest period - not 100%. In repeated interval scenarios, the effective W' available for each successive effort is smaller. The calculator uses the simpler linear model, which is adequate for single-effort predictions.
Test Execution Determines Output Quality
The calculator cannot correct for poor tests. Common problems:
- Pacing errors: going out too fast and fading produces a lower average than a true maximal effort
- Incomplete efforts: not reaching true physiological maximum
- Environmental variability: wind, hills, temperature, pool conditions
- Fatigue: testing in a fatigued state underestimates true CP/CV/CSS
Use three-test pair validation to identify outlier tests. Test under controlled conditions: flat track, indoor pool, no wind, rested state. Allow 24-48 hours between tests.
CP/CV/CSS Changes Over Time
These values are not fixed:
- Threshold training raises CP/CV by 5-15% over 8-12 focused weeks
- Inactivity for 2-3 weeks can reduce CP/CV by 10-20%
- Seasonal and health variation is common
Retest every 4-8 weeks during focused training blocks. Use results under 30 days old for race pacing decisions.
The Model Does Not Account for Variable Pacing
The hyperbolic model assumes constant-intensity efforts. Races involve surges, drafting, terrain, and tactical variation. Variable pacing complicates W'/D' accounting, as partial D' recovery occurs during slower segments. Think of CV/CSS as an anchor pace and W'/D' as a conceptual reserve - not a precise real-time gauge.
Sport-Specific Factors
- Cycling CP depends on position (aero vs. upright), equipment, and power meter calibration. Outdoor and indoor trainer values can differ by 5-10%.
- Running CV applies to flat, consistent surfaces. Road, track, trail, footwear, and uphill/downhill running all affect the relationship.
- Swimming CSS is pool-specific. Open water CSS is typically 5-10% slower due to sighting, currents, lack of push-off walls, and waves.
Test and apply in the same environment where you will race or train.
ℹ️ IMPORTANT DISCLAIMER
This calculator is for educational purposes only and does NOT constitute medical advice. Consult qualified professionals before making changes. Individual physiology varies. You assume all risk. Must be 18+.
References
-
Hill, D. W. (1993). The critical power concept: a review. Sports Medicine, 16(4), 237-254. https://doi.org/10.2165/00007256-199316040-00003
-
Jones, A. M., Vanhatalo, A., Burnley, M., Morton, R. H., & Poole, D. C. (2010). Critical power: implications for determination of VO2max and exercise tolerance. Medicine and Science in Sports and Exercise, 42(10), 1876-1890. https://doi.org/10.1249/MSS.0b013e3181d9cf7f
-
Monod, H., & Scherrer, J. (1965). The work capacity of a synergic muscular group. Ergonomics, 8(3), 329-338. https://doi.org/10.1080/00140136508930810
-
Poole, D. C., Burnley, M., Vanhatalo, A., Rossiter, H. B., & Jones, A. M. (2016). Critical power: an important fatigue threshold in exercise physiology. Medicine and Science in Sports and Exercise, 48(11), 2320-2334. https://doi.org/10.1249/MSS.0000000000000939
-
Wakayoshi, K., Ikuta, K., Yoshida, T., Udo, M., Moritani, T., Mutoh, Y., & Miyashita, M. (1992). Determination and validity of critical velocity as an index of swimming performance in the competitive swimmer. European Journal of Applied Physiology, 64(2), 153-157. https://doi.org/10.1007/BF00717953
Scientific Validation Notes
2-Parameter Hyperbolic Model: The equation y = theta + phi/t is the standard formulation validated across hundreds of studies. This calculator solves it exactly as published in Monod and Scherrer (1965), Hill (1993), and Wakayoshi et al. (1992). The closed-form 2-point solution is algebraically exact - no approximation is involved.
Morton 3-Parameter Extension: The time-shift model P = CP + W'/(t + k) is implemented via grid search over 2001 CP candidates. For each candidate, k and W' are solved analytically from the two shortest-to-longest test points, then evaluated by relative SSE across all three tests. The k parameter is bounded by empirical guardrails (not from Morton's original formulation) to prevent overfitting with suboptimal test spacing: k is capped at min(900 s, 2 × t1) for tests under 10 minutes, and min(1800 s, 1.5 × t1) for longer tests. If no feasible solution is found, the calculator falls back to pair validation.
Pair Validation Algorithm: Fitting each possible 2-point pair and validating against the third test is a field implementation of leave-one-out cross-validation. Prediction error above 10% on the validation test typically indicates a poorly executed trial. The algorithm selects the minimum-error pair automatically.
Test Spacing Requirements: The 1.5:1 minimum duration ratio prevents ill-conditioned estimation. As t1 and t2 converge, the denominator (1/t1 - 1/t2) approaches zero and amplifies any measurement error into large parameter errors. The 1.5:1 threshold keeps estimation error within practical bounds.
Physiological Correspondence: CP, CV, and CSS have been validated against blood lactate measurements across multiple sports. They typically fall slightly above the first lactate threshold and close to the maximal lactate steady state (MLSS), at roughly 100-105% of the first lactate rise and 95-100% of MLSS. This alignment makes CP/CV/CSS practical proxies for threshold-based training zones without requiring laboratory testing.
W'/D' Recovery: The calculator uses the linear depletion model (depletion rate proportional to excess above CP/CV). Research by Skiba et al. (2012) and others demonstrates that recovery is exponential with a time constant of 300-600 seconds, and is typically 70-85% complete after standard interval rest periods. For multi-bout interval predictions, the linear model underestimates cumulative fatigue. For single-effort predictions and race pacing, it is adequate.
External Validity: CV predictions have been validated against race times from 1500m to marathon. CSS predictions align with 400m race pace within 2-3%. CP predictions match 30-60 minute time trial performance within 2-5%.