Critical Power and Pacing (Multisport)
📋 What is Critical Threshold
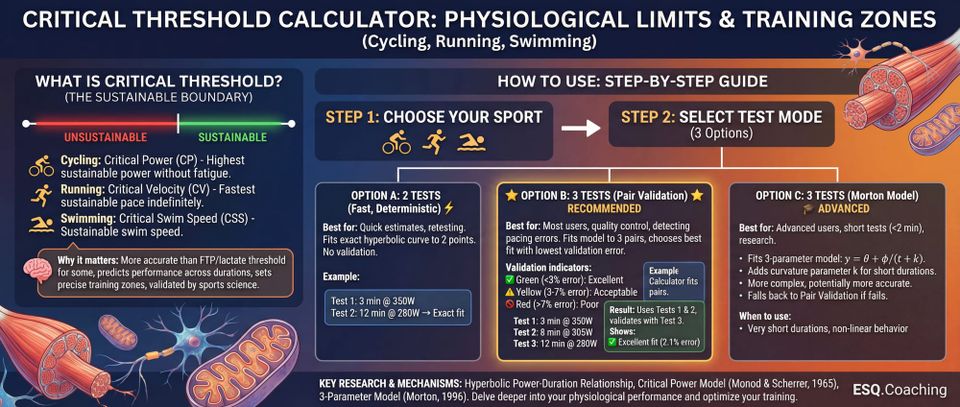
Critical Threshold represents the boundary between sustainable and unsustainable exercise intensity:
- 🚴 Cycling: Critical Power (CP) - The highest power you can sustain without fatigue
- 🏃 Running: Critical Velocity (CV) - The fastest pace you can maintain indefinitely
- 🏊 Swimming: Critical Swim Speed (CSS) - Your sustainable swim speed
Why it matters:
- More accurate than FTP or lactate threshold for some applications
- Predicts performance across different durations
- Helps set precise training zones
- Validated by decades of sports science research
🎯 STEP-BY-STEP GUIDE
STEP 1: Choose Your Sport
Click one of the three sport buttons at the top:
- 🚴 Cycling - Uses power meter data (watts)
- 🏃 Running - Uses distance and time (pace-based)
- 🏊 Swimming - Uses distance and time (pace-based)
STEP 2: Select Test Mode
Choose how you want to analyze your data:
Option A: 2 Tests (Fast, Deterministic) ⚡
Best for:
- Quick estimates
- Retesting to track progress
- When you only have 2 maximal efforts
How it works:
- Fits exact hyperbolic curve to your 2 test points
- No validation (assumes both tests are perfect)
- Fast calculation
Example:
Test 1: 3 min @ 350W
Test 2: 12 min @ 280W
→ Exact fit through both points
Option B: 3 Tests (Pair Validation) ⭐ RECOMMENDED
Best for:
- Most users
- Quality control
- Detecting pacing errors
How it works:
- Tests all 3 combinations of test pairs: (1,2), (1,3), (2,3)
- Fits model to each pair
- Predicts the 3rd point
- Chooses the pair with best validation
- Shows you the error on the unused point
Validation indicators:
- ✅ Green (<3% error): Excellent - very consistent pacing
- ⚠️ Yellow (3-7% error): Acceptable - minor inconsistency
- 🚫 Red (>7% error): Poor - retest recommended
Example:
Test 1: 3 min @ 350W
Test 2: 8 min @ 305W
Test 3: 12 min @ 280W

Calculator tries:
- Fit (1,2), predict 3: 2.1% error ← BEST
- Fit (1,3), predict 2: 5.8% error
- Fit (2,3), predict 1: 4.2% error

Result: Uses tests 1 & 2, validates with test 3
Shows: ✅ Excellent fit (2.1% error)
Option C: 3 Tests (Morton Model) 🎓 ADVANCED
Best for:
- Advanced users
- When you have very short duration tests (<2 min)
- Research or lab testing
How it works:
- Fits 3-parameter model:
y = θ + φ/(t + k) - Adds curvature parameter
kfor short durations - More complex but can be more accurate
- Automatically falls back to Pair Validation if it fails
When to use:
- You have a test under 90 seconds
- You want maximum accuracy
- You understand the model limitations
STEP 3: Enter Your Test Data
🚴 CYCLING
What you need:
- Power meter data (average watts)
- Duration of each effort (minutes)
Recommended test durations:
- Test 1 (short): 3-8 minutes
- Test 2 (long): 12-25 minutes
- Test 3 (middle): 6-10 minutes
Example input:
Test 1:
  Duration: 5 (minutes)
  Power: 350 (watts)

Test 2:
  Duration: 20 (minutes)
  Power: 280 (watts)
Important tips:
- Warm up 15-20 minutes before each test
- Ride at maximum sustainable power (not sprinting)
- Keep power as steady as possible
- Indoor trainer preferred (more consistent)
- Rest 24-48 hours between tests
🏃 RUNNING
What you need:
- Distance (meters)
- Time (can enter as MM:SS or total seconds)
Recommended test distances:
- Test 1 (short): 1200-1600 meters
- Test 2 (long): 3200-5000 meters
- Test 3 (middle): 2000-3000 meters
Example input:
Test 1:
  Distance: 1200 (meters)
  Time: 4:30 (or 270 seconds)

Test 2:
  Distance: 3200 (meters)
  Time: 12:15 (or 735 seconds)
Important tips:
- Use a track or flat, measured course
- Pace as evenly as possible
- All-out effort (maximal sustainable pace)
- GPS watches can be inaccurate - use known distances
- Similar conditions for all tests (weather, time of day)
🏊 SWIMMING
What you need:
- Distance (meters)
- Time (can enter as MM:SS.d with tenths of a second)
Recommended test distances:
- Test 1 (short): 200 meters
- Test 2 (long): 400-800 meters
- Test 3 (middle): 300-400 meters
Example input:
Test 1:
  Distance: 200 (meters)
  Time: 2:45.2 (or 165.2 seconds)

Test 2:
  Distance: 400 (meters)
  Time: 6:20.5 (or 380.5 seconds)
Important tips:
- Use pool swimming (more accurate than open water)
- Push-off and turns count (part of your race performance)
- Maximal effort from the start
- Maintain technique (don't thrash)
- Long course (50m) preferred over short course (25m)
STEP 4: Click Calculate
The calculator will:
- ✅ Validate your inputs (check for errors)
- 📊 Fit the appropriate model
- 📈 Generate a graph showing your tests and curve
- 📋 Display your results
- 🎯 Enable the pacing calculator
STEP 5: Understand Your Results
📊 THE GRAPH
The graph shows:
- Blue curve - Your power/speed model across all durations
- Purple dots - Test points used to fit the model
- Green/Yellow/Red dot - Validation point (3-test mode)
- Green: <3% error (excellent)
- Yellow: 3-7% error (acceptable)
- Red: >7% error (retest recommended)
What to look for:
- Points should be close to the curve
- No single point far from the line
- Smooth hyperbolic shape
📋 RESULTS METRICS
🚴 Cycling:
- Critical Power (CP): Your threshold in watts
- FTP (95% CP): Training intensity (~1 hour power)
- W' (Anaerobic Capacity): Energy above CP in kilojoules
🏃 Running:
- Critical Velocity (CV): Threshold speed (m/s)
- CV Pace: Threshold pace (min/km)
- Threshold Pace: Training pace (~1 hour)
- D' (Anaerobic Distance): Distance capacity in meters
- Race Predictions: Estimated times for 5K, 10K, Half Marathon
🏊 Swimming:
- CSS (Critical Swim Speed): Threshold speed (m/s)
- CSS Pace: Threshold pace (min/100m)
- T30 Pace: Training pace (~30 min sustainable)
- D' (Anaerobic Capacity): Distance capacity in meters
- Predicted Times: Estimates for 400m, 800m, 1500m
✅ VALIDATION STATUS
3-Test Pair Validation Mode shows:
✅ Excellent fit (2.1% error on test 3)
- Your pacing was very consistent
- High confidence in results
- Use these values for training
⚠️ Acceptable fit (5.2% error on test 2)
- Results are usable but slight inconsistency detected
- Consider retesting for more accuracy
- May have paced one test differently
🚫 Poor fit (9.8% error). Consider retesting with better pacing.
- Significant inconsistency detected
- One test likely paced incorrectly
- Retest with more even pacing
- Results less reliable
STEP 6: Use the Pacing Calculator
After getting your results, scroll down to the Pacing Calculator section.
🚴 Cycling Pacing:
Option 1: Estimate power for a duration
Input: 8 minutes
Output: 313 watts

Use this to: Plan interval training, predict race power
Option 2: Estimate duration for a power
Input: 300 watts
Output: 9.3 minutes

Use this to: See how long you can hold target power
🏃 Running Pacing:
Option 1: Predict race time
Input: 5000 meters (5K)
Output: 19:16

Use this to: Set race goals, predict performance
Option 2: Find max sustainable distance
Input: 4:00/km pace
Output: 8,450 meters

Use this to: Plan long runs, understand pace limits
🏊 Swimming Pacing:
Option 1: Predict swim time
Input: 1500 meters
Output: 26:52

Use this to: Plan race strategy, set goals
Option 2: Find max distance at pace
Input: 1:45/100m pace
Output: 1,240 meters

Use this to: Plan training sets
🎓 INTERPRETING YOUR RESULTS
What is a "good" result?
Validation (3-test mode):
- <3% error: Excellent - your tests are very reliable
- 3-5% error: Good - normal variation
- 5-7% error: Acceptable - some inconsistency
- >7% error: Poor - retest with better pacing
Absolute values depend on your fitness level, but here are some benchmarks:
🚴 Cycling CP (watts/kg):
- 5.0+ W/kg: World-class
- 4.0-5.0 W/kg: Competitive racer
- 3.0-4.0 W/kg: Strong amateur
- 2.5-3.0 W/kg: Recreational cyclist
- <2.5 W/kg: Beginner/fitness
🏃 Running CV (pace):
- <3:00/km: Elite
- 3:00-3:30/km: Competitive
- 3:30-4:30/km: Strong runner
- 4:30-5:30/km: Recreational
- >5:30/km: Beginner/fitness
🏊 Swimming CSS (pace/100m):
- <1:15/100m: Elite
- 1:15-1:30/100m: Competitive
- 1:30-1:50/100m: Strong swimmer
- 1:50-2:15/100m: Recreational
- >2:15/100m: Beginner/fitness
🔧 TROUBLESHOOTING
"Calculation failed. Check inputs and try again."
Possible causes:
- Empty fields - fill in all test data
- Negative numbers - use positive values only
- Test 1 must be shorter than Test 2
- Test 1 must be higher intensity than Test 2
Fix: Double-check your inputs follow the model assumptions
"Test 1 duration must be shorter than Test 2"
Cause: You entered a longer duration for Test 1
Fix:
- Test 1 should be the SHORT effort (3-8 min cycling, 1200-1600m running)
- Test 2 should be the LONG effort (12-25 min cycling, 3200-5000m running)
- Swap your test numbers if needed
"Test 1 value must be higher than Test 2"
Cause: Your shorter test has lower power/speed than longer test
Fix:
- Shorter efforts should be higher intensity
- Check you didn't mix up test data
- If data is correct, you may not have been maximal on the short test
High validation error (>7%)
Possible causes:
- Inconsistent pacing - One test had surges or fading
- Different conditions - Tests done in very different weather/fatigue
- Not maximal - One test wasn't truly all-out effort
- Equipment issues - Power meter drift, GPS errors, etc.
Solutions:
- Retest with more even pacing
- Use indoor/controlled environment
- Ensure all tests are genuinely maximal
- Check equipment calibration
Graph doesn't show
Cause: Chart.js library not loaded
Fix:
- Check browser console (F12) for errors
- Verify Chart.js CDN is accessible
- Try different browser
- Clear browser cache (Ctrl+Shift+R)
💡 TIPS FOR BEST RESULTS
Testing Protocol:
- Warm up properly
- 15-20 minutes easy
- 2-3 short accelerations
- Feel ready to give max effort
- Choose good conditions
- Similar weather/temperature
- No headwind (or consistent conditions)
- Not fatigued from previous training
- Pace evenly
- No sprint starts
- Avoid dying at the end
- Steady, sustainable max effort
- Rest between tests
- Minimum 24 hours
- Ideally 48 hours
- Fully recovered for each test
- Use proper equipment
- Calibrated power meter (cycling)
- Measured course (running)
- Pool with known distance (swimming)
When to Retest:
Retest if:
- Validation error >7%
- Results don't match perceived fitness
- Equipment changed (new bike, power meter)
- Training block completed
6 weeks since last test
How often to test:
- Every 4-6 weeks during training
- Start and end of training block
- Before and after rest/taper
- When fitness changes significantly
📚 UNDERSTANDING THE SCIENCE
The Hyperbolic Model
The calculator uses the equation:
y = θ + φ/tWhere:
- y = performance (power or speed)
- θ = threshold (CP, CV, or CSS)
- φ = capacity (W' or D')
- t = duration (time)
What this means:
- At very short durations, capacity dominates (high power/speed)
- At long durations, threshold dominates (sustainable power/speed)
- The curve connects these two extremes
Why This Works
Scientific basis:
- Energy systems have limited capacity above threshold
- This capacity depletes at rate: (intensity - threshold)
- Hyperbolic model accurately describes this relationship
- Validated across thousands of athletes and decades of research
Key papers:
- Monod & Scherrer (1965) - Original model
- Jones et al. (2010) - CP in sports
- Poole et al. (2016) - Critical Power concept
- Bundle et al. (2017) - CV predicts running performance
Limitations
The model works best:
- For efforts between 2-30 minutes
- With consistent pacing
- In similar conditions
- When truly maximal
The model breaks down:
- Very short (<90 seconds) - anaerobic dominates
- Very long (>40 minutes) - fatigue/fueling issues
- Inconsistent pacing - violates assumptions
- Different environments - wind, heat, hills
🎯 USING RESULTS FOR TRAINING
🚴 Cycling Training Zones
Based on your CP:
- Zone 1 (Recovery): <55% CP
- Zone 2 (Endurance): 55-75% CP
- Zone 3 (Tempo): 75-90% CP
- Zone 4 (Threshold): 90-105% CP
- Zone 5 (VO2max): 105-120% CP
- Zone 6 (Anaerobic): >120% CP
Example with CP = 250W:
- Z1: <138W
- Z2: 138-188W
- Z3: 188-225W
- Z4: 225-263W
- Z5: 263-300W
- Z6: >300W
🏃 Running Training Paces
Based on your CV:
- Easy: CV pace + 60-90 sec/km
- Tempo: CV pace + 15-30 sec/km
- Threshold: CV pace ± 5 sec/km
- Intervals: CV pace - 10-30 sec/km
Example with CV pace = 4:00/km:
- Easy: 5:00-5:30/km
- Tempo: 4:15-4:30/km
- Threshold: 3:55-4:05/km
- Intervals: 3:30-3:50/km
🏊 Swimming Training Sets
Based on your CSS:
- Aerobic: CSS pace + 10-20 sec/100m
- Threshold: CSS pace ± 5 sec/100m
- VO2max: CSS pace - 5-10 sec/100m
Example with CSS = 1:40/100m:
- Aerobic: 1:50-2:00/100m
- Threshold: 1:35-1:45/100m
- VO2max: 1:30-1:35/100m
✅ QUICK REFERENCE
🚴 CYCLING
- Tests: 3-8 min + 12-25 min
- Input: Duration (min) + Power (W)
- Output: CP (W), FTP (W), W' (kJ)
🏃 RUNNING
- Tests: 1200-1600m + 3200-5000m
- Input: Distance (m) + Time (MM:SS)
- Output: CV (m/s), Pace (min/km), D' (m)
🏊 SWIMMING
- Tests: 200m + 400-800m
- Input: Distance (m) + Time (MM:SS.d)
- Output: CSS (m/s), Pace (min/100m), D' (m)
VALIDATION
- <3%: ✅ Excellent
- 3-7%: ⚠️ Acceptable
7%: 🚫 Retest
📖 FURTHER READING
Want to learn more?
Check out these resources:
- "Training and Racing with a Power Meter" by Hunter Allen & Andrew Coggan
- "Daniels' Running Formula" by Jack Daniels
- "Science of Swimming Faster" by Scott Riewald
Research papers:
- Search "critical power" on PubMed or Google Scholar
- Look for papers by Andy Jones, David Poole, and Matt Bundle