Cycling Performance Snapshot
The Science Behind It
How the Calculator Works
-
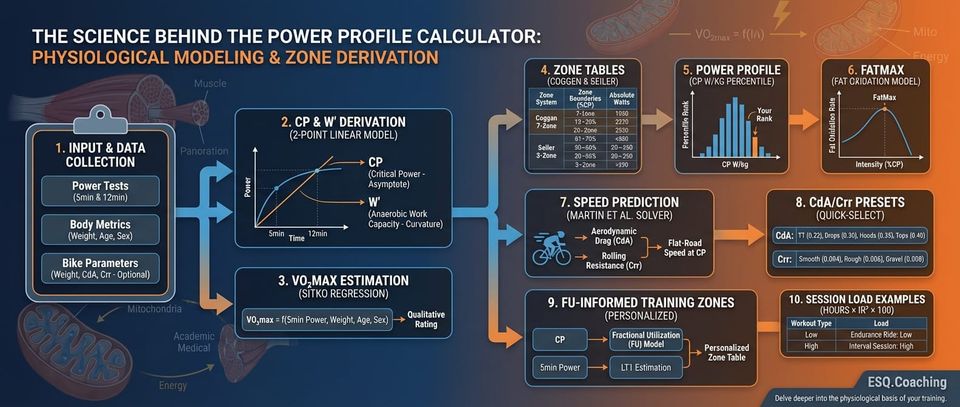
Input: Two maximal power tests (5-minute and 12-minute), body weight, age, sex, and optional bike parameters (weight, CdA, Crr).
-
CP & W' derivation: The two-point linear model extracts Critical Power (the asymptote of the power-duration curve) and W' (the curvature constant representing anaerobic work capacity in joules).
-
VO2max estimation: The 5-minute power value is fed into the Sitko regression to produce an estimated VO2max with a qualitative rating.
-
Zone tables: CP anchors both the Coggan 7-zone and Seiler 3-zone systems. Each zone boundary is expressed as a percentage of CP, converted to absolute watts.
-
Power profile: CP expressed as W/kg is looked up against population percentile data for the ~20-minute duration range.
-
FatMax: The fat oxidation model identifies the intensity (as % of CP) where fat burning is maximized.
-
Speed prediction: At CP, the Martin et al. solver calculates flat-road speed using the provided (or default) aerodynamic and rolling resistance values.
-
CdA/Crr presets: Quick-select buttons populate common aerodynamic and rolling resistance values. CdA presets: TT (0.22), Drops (0.30), Hoods (0.35), Tops (0.40). Crr presets: Smooth road (0.004), Rough road (0.006), Gravel (0.008). These provide realistic defaults for athletes without wind-tunnel or rolldown test data.
-
FU-informed training zones: When both CP and 5-minute power are provided, the calculator derives Fractional Utilization (FU) using
PerfMath.fuAdjustedZones. This personalizes zone boundaries by estimating LT1 from the FU model and setting a VO2max interval target based on the 5-minute power. The result is a zone table that reflects the athlete's individual aerobic profile rather than generic percentage-based zones. -
Session load examples: Illustrative session loads (hours × IR² × 100) are shown for different workout types.
Practical Application
Scenario 1: Trained club cyclist (75 kg, 5-min power 310W, 12-min power 275W)
- CP: ~263W (3.5 W/kg)
- W': ~14.1 kJ
- VO2max: ~53.4 mL/kg/min (Good)
- Power Profile: ~65th percentile
- FatMax zone: ~132-158W
- Flat speed at CP: ~37.2 km/h (with typical road bike parameters)
Scenario 2: Competitive amateur (68 kg, 5-min power 360W, 12-min power 320W)
- CP: ~309W (4.5 W/kg)
- W': ~15.3 kJ
- VO2max: ~63.6 mL/kg/min (Excellent)
- Power Profile: ~85th percentile
- FatMax zone: ~155-185W
- Flat speed at CP: ~40.1 km/h
These profiles give the athlete a comprehensive fitness fingerprint that would typically require multiple independent tests and calculators to assemble.
Why This Matters
Cyclists typically assess fitness through isolated tests - a Critical Power test here, a VO2max estimate there, a zone table from yet another source. The Cycling Performance Snapshot consolidates these into a single comprehensive assessment. Two maximal-effort power tests and basic physiological data produce a complete picture: threshold power, anaerobic capacity, training zones (two systems), VO2max estimate, power profile percentile, fat oxidation zone, and predicted speeds.
This approach mirrors what a sports science lab delivers in a single testing session, but derived from field data the athlete already has.
The Research
The snapshot calculator reuses validated models from existing calculators, each with its own evidence base:
Critical Power (2-point linear model). The CP concept was introduced by Monod & Scherrer (1965) and later refined for cycling by Moritani et al. (1981). The linear two-point model (CP = (P1×t1 - P2×t2) / (t1 - t2)) provides a field-practical estimate of the power-duration boundary between steady-state and non-steady-state exercise. W' represents the finite work capacity above CP. While the full hyperbolic model requires 3+ trials, the two-point estimate produces values within 3-5% of laboratory-derived CP when test durations are appropriately spaced (5 and 12 minutes).
VO2max from Power (Sitko et al., 2022). The Sitko regression (VO2max = 16.6 + 8.87 × power/mass) was derived from a cohort of trained cyclists performing 5-minute maximal tests. This provides a practical field estimate without requiring gas exchange equipment. SEE = 3.5 mL/kg/min.
Coggan Power Zones. The 7-zone model attributed to Andrew Coggan divides intensity into Active Recovery through Neuromuscular Power, anchored to functional threshold power. This system is the de facto standard in structured cycling training.
Seiler Intensity Zones. Stephen Seiler's 3-zone polarized model (below VT1/LT1, between VT1 and VT2/LT2, above VT2/LT2) is supported by research showing that elite endurance athletes distribute approximately 80% of training volume in Zone 1, with the remainder split between Zone 2 and Zone 3 (Seiler & Kjerland, 2006).
Power Profile (Cycling Analytics). Percentile rankings based on large-sample power data allow athletes to contextualize their CP relative to the broader cycling population. Rankings span from Untrained (<5th percentile) through World Class (>99th).
Fat Oxidation Model. The crossover concept (Brooks & Mercier, 1994) describes the shift from fat to carbohydrate oxidation as exercise intensity increases. The model estimates fat oxidation fraction as a function of %VO2max, with peak fat oxidation (FatMax) typically occurring at 45-65% of VO2max.
Power-to-Speed (Martin et al., 1998). The fundamental equation P = F_gravity + F_rolling + F_aero relates power output to road speed via gravitational, rolling resistance, and aerodynamic drag forces. Newton's method iteratively solves for speed given power, mass, gradient, CdA, and Crr.
Limitations
-
The 2-point CP model is an approximation. With only two test durations, the model cannot detect non-linearity in the power-duration relationship. Adding a third trial (e.g., 20-minute or 2-minute) would improve reliability. The 2-point estimate can deviate 3-5% from laboratory values.
-
VO2max estimation has inherent error. The Sitko regression has a standard error of ~3.5 mL/kg/min. A direct gas exchange test remains the gold standard. The estimate also assumes the 5-minute effort was truly maximal.
-
Coggan zones are coaching conventions, not physiological thresholds. The zone boundaries (e.g., 56-75% for Tempo, 76-90% for Threshold) are practical guidelines, not individually calibrated physiological markers. Actual ventilatory and lactate thresholds may differ.
-
Power profile percentiles depend on the reference population. Rankings are based on data from Cycling Analytics users, which skews toward enthusiast and competitive cyclists. An "average" ranking here is well above population average.
-
Speed prediction assumes flat, windless, steady-state conditions. Real-world speed varies with gradient, wind, drafting, road surface, and pacing strategy.
-
Fat oxidation is estimated, not measured. Individual FatMax varies considerably with training status, diet, and test conditions. A metabolic cart test provides the definitive measurement.
-
FU-informed zones require accurate 5-minute power. The FU model assumes 5-minute power approximates VO2max power; athletes with high anaerobic capacity may see skewed zone boundaries. If your 5-minute effort was not a true maximal aerobic effort, the derived LT1 estimate and personalized zone boundaries will be less reliable.
ℹ️ IMPORTANT DISCLAIMER
This calculator is for educational purposes only and does NOT constitute medical advice. Consult qualified professionals before making changes. Individual physiology varies. You assume all risk. Must be 18+.
References
Monod, H., & Scherrer, J. (1965). The work capacity of a synergic muscular group. Ergonomics, 8(3), 329--338. https://doi.org/10.1080/00140136508930810
Moritani, T., Nagata, A., deVries, H. A., & Muro, M. (1981). Critical power as a measure of physical work capacity and anaerobic threshold. Ergonomics, 24(5), 339--350. https://doi.org/10.1080/00140138108924856
Sitko, S., Cirer-Sastre, R., & Lopez Laval, I. (2022). Five-minute power-based test to predict maximal oxygen consumption in road cycling. International Journal of Sports Physiology and Performance, 17(1), 9--15. https://doi.org/10.1123/ijspp.2020-0923
Seiler, K. S., & Kjerland, G. O. (2006). Quantifying training intensity distribution in elite endurance athletes. European Journal of Applied Physiology, 98(2), 199--209. https://doi.org/10.1007/s00421-006-0254-x
Brooks, G. A., & Mercier, J. (1994). Balance of carbohydrate and lipid utilization during exercise: the "crossover" concept. Journal of Applied Physiology, 76(6), 2253--2261. https://doi.org/10.1152/jappl.1994.76.6.2253
Martin, J. C., Milliken, D. L., Cobb, J. E., McFadden, K. L., & Coggan, A. R. (1998). Validation of a mathematical model for road cycling power. Journal of Applied Biomechanics, 14(3), 276--291. https://doi.org/10.1123/jab.14.3.276