FatMax & Substrate Utilization
The Science Behind It
How the Calculator Works
The calculator approximates fat oxidation fraction using a simplified formula:
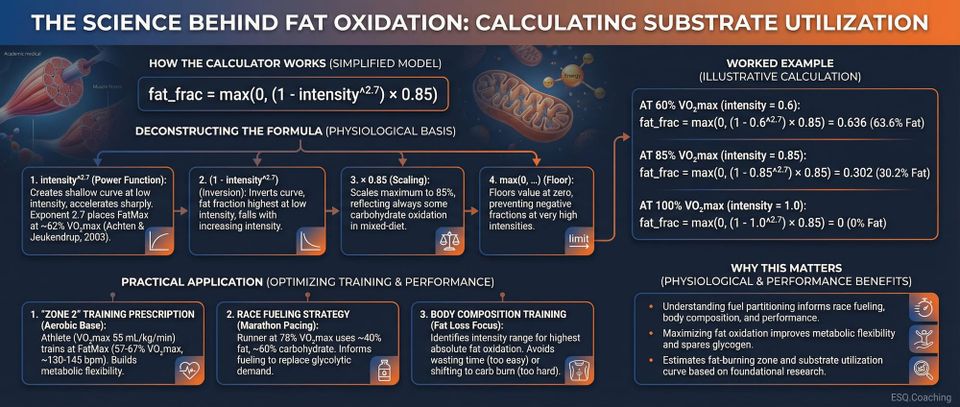
fat_frac = max(0, (1 - intensity2.7) × 0.85)
where:
- fat_frac = fraction of total energy derived from fat (0 to 1)
- intensity = relative exercise intensity expressed as a decimal (0.0 to 1.0, where 1.0 = VO2max)
Deconstructing the Formula
- intensity2.7: This power function creates a curve that is very shallow at low intensities and accelerates sharply at higher intensities. The exponent 2.7 was chosen to place the FatMax peak at approximately 62% VO2max, consistent with the Achten & Jeukendrup (2003) population mean of 62.5%.
- (1 - intensity2.7): This inverts the curve so that fat fraction is highest at low intensity and falls with increasing intensity.
- x 0.85: This scales the maximum fat fraction to 85%, reflecting that even at very low intensities, some carbohydrate is always oxidized in mixed-diet conditions.
- max(0, ...): This floors the value at zero, preventing negative fat fractions at very high intensities.
Worked Example
At 60% VO2max (intensity = 0.6):
fat_frac = max(0, (1 - 0.62.7) × 0.85)
= max(0, (1 - 0.2518) × 0.85)
= max(0, 0.7482 × 0.85)
= max(0, 0.636)
= 0.636 (63.6% of energy from fat)
At 85% VO2max (intensity = 0.85):
fat_frac = max(0, (1 - 0.852.7) × 0.85)
= max(0, (1 - 0.6448) × 0.85)
= max(0, 0.3552 × 0.85)
= max(0, 0.302)
= 0.302 (30.2% of energy from fat)
At 100% VO2max (intensity = 1.0):
fat_frac = max(0, (1 - 1.02.7) × 0.85)
= max(0, (1 - 1.0) × 0.85)
= max(0, 0)
= 0 (0% of energy from fat)
Practical Application
-
"Zone 2" training prescription: An athlete with a VO2max of 55 mL/kg/min wants to train at FatMax to build aerobic base. The calculator places their peak fat-burning zone at approximately 57-67% VO2max, which corresponds to roughly 130-145 bpm depending on age and individual heart rate profile. This aligns with the widely recommended "Zone 2" training range.
-
Race fueling strategy: A marathon runner operating at 78% VO2max can estimate that roughly 40% of their energy comes from fat, meaning approximately 60% from carbohydrate. This informs in-race fueling: they will need to consume carbohydrate at a rate that partially replaces the glycolytic demand.
-
Body composition training: An athlete prioritizing fat loss can use the calculator to identify the intensity range where absolute fat oxidation is highest (not just relative). Training too easily wastes time; training too hard shifts to carbohydrate burning and may compromise session duration.
Why This Matters
Understanding how your body partitions fuel between fat and carbohydrate during exercise has direct implications for race fueling, body composition, and endurance performance. Training at the right intensity to maximize fat oxidation can improve metabolic flexibility, spare glycogen for when it matters most, and inform nutrition strategies. This calculator estimates your fat-burning zone and substrate utilization curve based on foundational exercise physiology research.
The Research
Brooks & Mercier (1994) - The Crossover Concept
The conceptual foundation comes from a seminal paper by George A. Brooks and Jacques Mercier, published in the Journal of Applied Physiology (76(6): 2253-2261, 1994). This paper introduced the "crossover concept" - a framework for understanding how the body shifts between fat and carbohydrate as exercise intensity increases.
Key Principles:
- At rest and low exercise intensities, lipid (fat) oxidation predominates.
- As exercise intensity increases, the body progressively shifts toward carbohydrate oxidation.
- The crossover point is the exercise intensity at which carbohydrate-derived energy surpasses fat-derived energy.
- After endurance training, the crossover point shifts to the right (higher intensities), meaning trained athletes can burn more fat at a given intensity.
Brooks and Mercier proposed that this shift is driven by two opposing forces: exercise intensity effects (which promote carbohydrate use via increased glycolytic flux, catecholamine release, and motor unit recruitment) and training adaptations (which enhance fat oxidation via increased mitochondrial density, capillarization, and fat transport proteins).
Modern data from more than 5,000 exercise calorimetries places the average crossover point at approximately 55.1% of VO2max, but with wide inter-individual variability.
Achten & Jeukendrup (2003) - Quantifying FatMax
The empirical quantification came from Juul Achten and Asker Jeukendrup at the University of Birmingham, published in the International Journal of Sports Medicine (24(8): 603-608, 2003) under the title "Maximal fat oxidation during exercise in trained men."
Study Design:
- Subjects: 55 endurance-trained male cyclists/triathletes
- Protocol: Graded exercise test on a cycle ergometer, with 5-minute stages at increasing power outputs
- Measurements: Indirect calorimetry (oxygen consumption and carbon dioxide production) to calculate fat and carbohydrate oxidation rates using stoichiometric equations
Key Findings:
- Maximal fat oxidation rate (MFO) was 0.52 +/- 0.15 g/min
- FatMax (the intensity eliciting MFO) occurred at 62.5 +/- 9.8% of VO2max
- Fat oxidation was negligible (FatMin) at 86.1 +/- 6.8% of VO2max
- The fat oxidation curve followed a characteristic inverted-U shape: increasing from low intensity, peaking at FatMax, then declining toward zero at high intensities
Mathematical Modeling:
Achten and Jeukendrup compared three methods for characterizing the fat oxidation curve:
- Measured values (MV) - direct data points
- 3rd-order polynomial fit - a cubic equation fit to the data
- Sinusoidal (SIN) model - a sine-wave function with parameters for dilatation, symmetry, and translation
All three methods produced similar FatMax estimates, confirming the robustness of the inverted-U relationship.
Limitations
-
The simplified formula does not produce the inverted-U shape. The actual fat oxidation curve from Achten & Jeukendrup (2003) increases from low to moderate intensity and then decreases. The calculator's formula monotonically decreases from rest, meaning it overestimates fat fraction at very low intensities. The peak absolute fat oxidation rate emerges from the product of total energy expenditure and fat fraction, which the formula handles correctly by placing FatMax near 62% VO2max - but the shape of the curve differs from empirical data.
-
Inter-individual variation is enormous. Even within Achten and Jeukendrup's homogeneous group of trained men, FatMax ranged from approximately 42% to 82% of VO2max. Training status, diet (especially carbohydrate availability), glycogen stores, caffeine intake, and genetics all substantially influence fat oxidation rates.
-
The 0.85 scaling factor is approximate. At very low exercise intensities (~25% VO2max), fat can account for up to 90-95% of substrate oxidation in fasted, trained individuals. In fed conditions, the maximum fat contribution is lower.
-
Training state shifts the entire curve. Endurance-trained athletes have FatMax at higher intensities and higher peak fat oxidation rates compared to untrained individuals. The calculator uses a single curve that does not account for training status.
-
Nutrition has a massive effect. A high-carbohydrate meal 2-3 hours before exercise suppresses fat oxidation substantially. The calculator does not account for fed versus fasted state.
-
The original research used cycling. Fat oxidation rates during running tend to be higher than during cycling at the same relative intensity (Achten et al., 2003), likely due to greater active muscle mass. The calculator may slightly underestimate fat oxidation for running.
⚠️ HEALTH & TRAINING GUIDANCE
Individual results vary significantly. Consult a sports medicine professional before making changes based on these estimates.
ℹ️ IMPORTANT DISCLAIMER
This calculator is for educational purposes only and does NOT constitute medical advice. Consult qualified professionals before making changes. Individual physiology varies. You assume all risk. Must be 18+.
References
-
Brooks, G. A., & Mercier, J. (1994). Balance of carbohydrate and lipid utilization during exercise: the "crossover" concept. Journal of Applied Physiology, 76(6), 2253-2261.
-
Achten, J., & Jeukendrup, A. E. (2003). Maximal fat oxidation during exercise in trained men. International Journal of Sports Medicine, 24(8), 603-608. https://doi.org/10.1055/s-2003-43265
-
Achten, J., Gleeson, M., & Jeukendrup, A. E. (2002). Determination of the exercise intensity that elicits maximal fat oxidation. Medicine & Science in Sports & Exercise, 34(1), 92-97.
-
Venables, M. C., Achten, J., & Jeukendrup, A. E. (2005). Determinants of fat oxidation during exercise in healthy men and women: a cross-sectional study. Journal of Applied Physiology, 98(1), 160-167.
-
Achten, J., & Jeukendrup, A. E. (2004). Optimizing fat oxidation through exercise and diet. Nutrition, 20(7-8), 716-727.
-
Maunder, E., Plews, D. J., & Kilding, A. E. (2018). Contextualising maximal fat oxidation during exercise: determinants and normative values. Frontiers in Physiology, 9, 599.