Grade-Adjusted Pace (GAP)
The Science Behind It
How the Calculator Works
Enter a gradient (between -30% and +30%) and your actual pace in MM:SS format. The calculator converts that gradient into a flat-equivalent pace using the Minetti metabolic cost model.
Inputs:
- Gradient (%) - positive for uphill, negative for downhill; range -30% to +30%
- Actual Pace (MM:SS) - per km or per mile
- Pace Unit - per km or per mile
Outputs:
- Grade-Adjusted Pace (GAP) in the same unit
- Effort multiplier relative to flat
- Pace difference (how much faster or slower GAP is vs. actual)
- Contextual note on the gradient's metabolic effect
The Minetti (2002) Polynomial
Minetti and colleagues fit a 5th-order polynomial to their metabolic cost measurements:
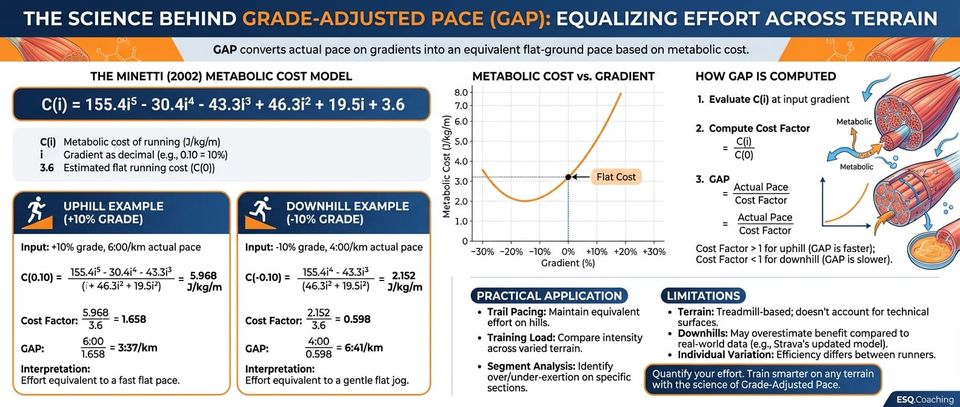
C(i) = 155.4i^5 - 30.4i^4 - 43.3i^3 + 46.3i^2 + 19.5i + 3.6
where:
- C(i) = metabolic cost of running in J/kg/m (joules per kilogram of body mass per meter of distance)
- i = gradient as a decimal (e.g., 0.10 for 10% grade, -0.05 for -5% grade)
The constant term 3.6 represents the polynomial's estimate of flat running cost. The measured value in the study was 3.40 +/- 0.24 J/kg/m, so the polynomial sits near the top of the standard deviation at flat - this is a small trade-off from fitting the curve across the full gradient range.
The six coefficients are: 155.4, -30.4, -43.3, 46.3, 19.5, 3.6. These match the published values in Minetti et al. (2002) exactly.
How GAP is Computed
The calculator:
- Evaluates C(0) = 3.6 J/kg/m (flat running cost)
- Evaluates C(i) at your input gradient (gradient / 100 to convert % to decimal)
- Computes cost factor = C(i) / C(0)
- GAP = actual pace / cost factor
If you are running harder than flat (cost factor > 1), GAP is a faster pace than actual. If you are running easier than flat (cost factor < 1), GAP is slower.
Worked Example - Running uphill at 10% grade:
C(0.10) = 155.4(0.10)^5 - 30.4(0.10)^4 - 43.3(0.10)^3 + 46.3(0.10)^2 + 19.5(0.10) + 3.6
= 0.001554 - 0.00304 - 0.0433 + 0.463 + 1.95 + 3.6
= 5.968 J/kg/m
Cost factor = 5.968 / 3.6 = 1.658
Running at 6:00/km uphill at 10%, GAP = 6:00 / 1.658 = 3:37/km. That uphill effort is metabolically equivalent to a fast flat pace.
Worked Example - Running downhill at -10% grade:
C(-0.10) = 155.4(-0.10)^5 - 30.4(-0.10)^4 - 43.3(-0.10)^3 + 46.3(-0.10)^2 + 19.5(-0.10) + 3.6
= -0.001554 - 0.00304 + 0.0433 + 0.463 - 1.95 + 3.6
= 2.152 J/kg/m
Cost factor = 2.152 / 3.6 = 0.598
Running at 4:00/km downhill at -10%, GAP = 4:00 / 0.598 = 6:41/km. That fast downhill pace is metabolically easy, equivalent to a gentle jog on flat ground.
Validated Speed Range
The Minetti study validated the polynomial at running speeds of 1.8-12.6 km/h. If your entered pace falls outside this range, the calculator flags it with a note. The polynomial itself remains mathematically valid across the full +-30% gradient input range - verified to stay positive throughout (minimum is approximately 1.78 J/kg/m near -18% grade).
Strava's Implementation
Strava originally used the Minetti polynomial for their GAP calculation. In 2017, Strava updated their algorithm using heart rate data from 240,000 athletes. The updated model closely matches Minetti for positive gradients but diverges on negative gradients. Strava found that the actual minimum metabolic cost occurs closer to -10% grade and does not drop as dramatically as the polynomial predicts. Strava also applies the adjustment to distance rather than pace.
The calculator on this page uses the original Minetti polynomial without modification. This is the appropriate choice for uphill calculations. On steep downhills (below -10%), it may overestimate the metabolic benefit relative to real-world conditions.
Practical Application
-
Trail race pacing: Your flat marathon pace is 5:00/km. On uphills at 10% grade, running at 7:30-8:00/km keeps you at equivalent effort - GAP confirms you are on target.
-
Training load comparison: Your coach prescribes 10 km at threshold effort. You ran it on a hilly route and averaged 4:45/km, but your GAP was 4:15/km - confirming you hit the target intensity despite the terrain.
-
Race segment analysis: After a mountain marathon, analyze each segment's GAP to identify where you over-exerted (GAP faster than planned) and where you backed off (GAP slower). This is more informative than raw pace on variable terrain.
Why This Matters
If you finish a hilly run and wonder why your average pace was slower than usual despite working just as hard, GAP is the answer. It translates actual pace on hilly terrain into the equivalent flat-ground pace based on metabolic effort. For trail runners, ultramarathon athletes, and anyone training on varied terrain, GAP allows fair comparison between hilly and flat efforts.
The Research
Minetti et al. (2002) - The Foundational Study
The core science comes from a study by Alberto Minetti, Christian Moia, Giulio Sergio Roi, Davide Susta, and Guido Ferretti, published in the Journal of Applied Physiology (93: 1039-1046, 2002): "Energy cost of walking and running at extreme uphill and downhill slopes."
Study Design:
- Subjects: 10 male runners
- Protocol: Treadmill running and walking at gradients from -0.45 to +0.45 (-45% to +45%)
- Measurements: Metabolic energy cost via indirect calorimetry (oxygen consumption and carbon dioxide production)
- Speeds: Multiple speeds tested at each gradient to establish speed-independence of running cost
Key Findings:
- Flat running cost: 3.40 +/- 0.24 J/kg/m, independent of speed
- Steep uphill cost at +45% grade: 18.93 +/- 1.74 J/kg/m
- Minimum cost at approximately -20% grade: 1.73 +/- 0.36 J/kg/m
- Steep downhill cost at -45% grade: 3.92 +/- 0.81 J/kg/m (higher than flat due to eccentric braking)
The U-shaped cost curve on downhills is the key insight: gentle downhills reduce metabolic cost, but steep downhills eventually cost more than flat running due to eccentric muscle contractions required for braking.
Limitations
-
Terrain and surface are not modeled. The study used a treadmill. Trail running on rocks, roots, and uneven surfaces increases metabolic cost beyond what gradient alone predicts. Technical downhills may cost substantially more than the polynomial suggests.
-
The polynomial was fit to gradients from -45% to +45%. This calculator restricts input to -30% to +30% where the polynomial is well-behaved. Extrapolation beyond -45% or +45% would be unreliable.
-
Individual variation exists. Some runners are more efficient uphill relative to flat; others descend more efficiently. The polynomial is an average across 10 subjects.
-
Fatigue effects are absent. Late in an ultra, the metabolic cost at any gradient increases due to reduced running economy. GAP does not account for progressive efficiency loss.
-
The 10-subject sample size is small by modern standards. The metabolic measurements were gold-standard (indirect calorimetry) and the study has been broadly confirmed by subsequent research, including Strava's large dataset for uphill gradients.
-
Walking transitions are not captured. On very steep gradients (above approximately +20-25%), most runners switch to power hiking, which has a different cost curve. The Minetti paper measured walking costs separately, but this calculator uses only the running polynomial.
ℹ️ IMPORTANT DISCLAIMER
This calculator is for educational purposes only and does NOT constitute medical advice. Consult qualified professionals before making changes. Individual physiology varies. You assume all risk. Must be 18+.
References
-
Minetti, A. E., Moia, C., Roi, G. S., Susta, D., & Ferretti, G. (2002). Energy cost of walking and running at extreme uphill and downhill slopes. Journal of Applied Physiology, 93(3), 1039-1046. https://doi.org/10.1152/japplphysiol.01177.2001
-
Strava Engineering. (2017). Improving Grade Adjusted Pace. Strava Engineering Blog. https://medium.com/strava-engineering/improving-grade-adjusted-pace-b9a2a332a5dc
-
Schroeder, A. (2021). Reverse-engineering Strava's Grade Adjusted Pace. https://aaron-schroeder.github.io/reverse-engineering/grade-adjusted-pace.html
-
Minetti, A. E. (1995). Optimum gradient of mountain paths. Journal of Applied Physiology, 79(5), 1698-1703.