Glycogen Depletion / Wall Predictor
The Science Behind It
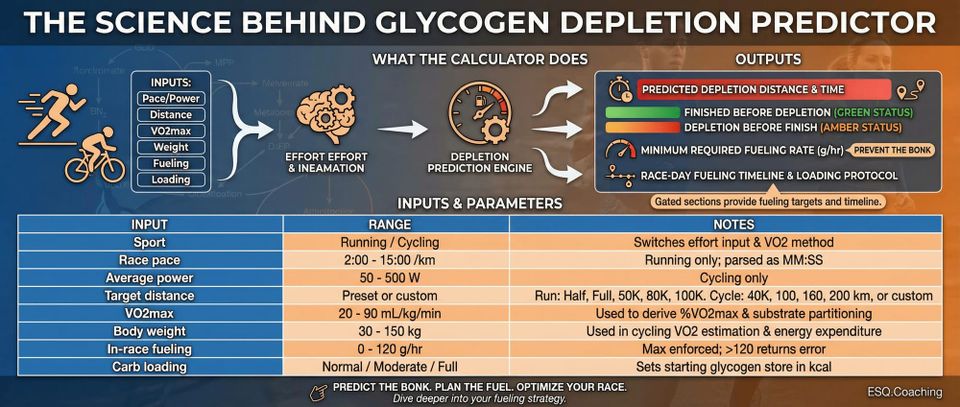
What the Calculator Does
The Glycogen Depletion Predictor estimates when you will run out of stored carbohydrate fuel during a running or cycling event, and prescribes the fueling rate needed to prevent it. Enter your pace or power, target distance, VO2max, body weight, planned fueling rate, and carb-loading status. The calculator outputs:
- The predicted distance and time at which glycogen stores hit zero (the "wall" for runners, "bonk" for cyclists)
- A green/amber status banner showing whether you finish before depletion
- The minimum fueling rate (g/hr) required to complete the event without depleting stores
- A race-day fueling timeline with per-checkpoint targets and pre-race carb-loading protocol
Gated sections (free members see primary result; paid members see full recommendations and timeline) include the fueling recommendation, timeline, and methodology note.
Inputs
| Input | Range | Notes |
|---|---|---|
| Sport | Running / Cycling | Switches the effort input and VO2 estimation method |
| Race pace | 2:00 - 15:00 /km | Running only; parsed as MM:SS |
| Average power | 50 - 500 W | Cycling only |
| Target distance | Preset or custom | Running: half, marathon, 50K, 80K, 100K. Cycling: 40K, 100, 160, 200 km, or custom |
| VO2max | 20 - 90 mL/kg/min | Used to derive %VO2max and substrate partitioning |
| Body weight | 30 - 150 kg | Used in cycling VO2 estimation and energy expenditure |
| In-race fueling | 0 - 120 g/hr | Maximum enforced at input; >120 returns an error |
| Carb loading | Normal / Moderate / Full | Sets starting glycogen store in kcal |
The Metabolic Model
Step 1: Estimate Exercise Intensity (%VO2max)
Running uses the ACSM running metabolic equation:
VO2 (mL/kg/min) = (speedm/min × 0.2) + 3.5
where speed in m/min = 1000 / pace_seconds x 60.
Cycling uses the ACSM cycle ergometry equation:
VO2 (mL/kg/min) = (10.8 × powerW / bodymass,kg) + 7
In both cases, exercise intensity is then:
fractionVO2max = min(0.95, estimatedVO2 / VO2max)
The 0.95 cap prevents the fraction exceeding physiological limits when input pace or power implies a very high VO2 relative to the stated VO2max.
Step 2: Total Energy Expenditure Rate
totalEnergy (kcal/min) = (VO2max × fractionVO2max × weight / 1000) × 4.85
This converts oxygen consumption (L/min) to calories using 4.85 kcal per litre of O2, a standard value for mixed-substrate exercise. The term VO2max × fractionVO2max × weight / 1000 is absolute VO2 in L/min.
Step 3: Substrate Partitioning (Carbohydrate Fraction)
carbFraction = min(1.0, 0.15 + 1.1 × fractionVO2max)
This is a linear approximation of the crossover concept (Brooks & Mercier). At 50% VO2max it yields carbFraction = 0.70; at 70% VO2max = 0.92; at 85% VO2max = 1.0 (capped). These values are higher than the classic crossover literature suggests at lower intensities - the linear formula overestimates carbohydrate contribution below about 50% VO2max - but it is accurate to within a reasonable margin for race-intensity efforts above 60% VO2max, which is the relevant domain for this calculator.
Step 4: Glycogen Starting Stores
The carb-loading selection maps directly to a fixed kcal value:
| Selection | Glycogen (kcal) |
|---|---|
| Normal (~400g) | 1,600 kcal |
| Moderate (~550g) | 2,200 kcal |
| Full carb-load (~700g) | 2,800 kcal |
These values represent total body carbohydrate availability (muscle glycogen + liver glycogen) expressed as kcal, consistent with Rapoport (2010) and the Scandinavian muscle biopsy literature. The practical range of 1,600 to 2,800 kcal is well-supported.
Step 5: Net Glycogen Depletion Rate
carbBurn (kcal/min) = totalEnergy × carbFraction
fuelingKcal (kcal/min) = fuelingRateg/hr × 4 / 60
netDepletion (kcal/min) = carbBurn - fuelingKcal
The fueling term converts g/hr of carbohydrate to kcal/min at 4 kcal/g. If netDepletion <= 0, fueling covers carbohydrate demand and the calculator reports "No Wall/Bonk."
Step 6: Distance and Time to Depletion
When netDepletion is positive (stores draining):
timeToWall (min) = glycogenKcal / netDepletion
distanceToWall (km) = (speedKph / 60) x timeToWall
For cycling, speed is estimated from a Newton-Raphson iteration of the flat-road power equation:
0.5 x CdA × ρ × v³ + Crr × mass × g × v = power × 0.97
using CdA = 0.32, Crr = 0.005, ρ = 1.225 kg/m³, g = 9.81 m/s², and a 3% drivetrain efficiency loss. This is a simplified flat-road model; actual speed varies with gradient, wind, and drafting.
Step 7: Recommended Fueling Rate
totalCarbNeeded (kcal) = carbBurn × eventDurationmin
carbDeficit (kcal) = totalCarbNeeded - glycogenKcal
recommendedFueling (g/hr) = max(0, (carbDeficit / 4) / eventDuration_hr)
If the raw recommendation exceeds 120 g/hr, the output is capped at 120 g/hr and a safety warning is displayed noting the physiological absorption ceiling.
Worked Example
Runner profile: 70 kg, VO2max = 55 mL/kg/min, pace 4:30/km, moderate carb loading (2,200 kcal), 60 g/hr fueling, marathon distance.
Step 1: VO2 and intensity
- Speed = 1000/270 × 60 = 222.2 m/min
- estimatedVO2 = 222.2 × 0.2 + 3.5 = 47.9 mL/kg/min
- fractionVO2max = 47.9 / 55 = 0.871
Step 2: Total energy
- Absolute VO2 = 55 × 0.871 × 70 / 1000 = 3.353 L/min
- totalEnergy = 3.353 × 4.85 = 16.26 kcal/min
Step 3: Carb fraction
- carbFraction = min(1.0, 0.15 + 1.1 × 0.871) = min(1.0, 1.108) = 1.0
Step 4: Stores
- glycogenKcal = 2,200 kcal
Step 5: Net depletion
- carbBurn = 16.26 × 1.0 = 16.26 kcal/min
- fuelingKcal = 60 × 4 / 60 = 4.0 kcal/min
- netDepletion = 16.26 - 4.0 = 12.26 kcal/min
Step 6: Wall prediction
- timeToWall = 2200 / 12.26 = 179.4 min
- speedKph = 1000/270 × 3.6 = 13.33 km/h
- distanceToWall = (13.33 / 60) × 179.4 = 39.9 km
At this pace with moderate loading and 60 g/hr fueling, the wall is predicted at ~39.9 km - before the marathon finish. The calculator recommends increasing fueling to cover the deficit.
Fueling Thresholds and Absorption
The calculator uses three absorption tiers to classify in-race fueling sources:
| Rate | Carb source required | Note |
|---|---|---|
| 0 - 60 g/hr | Single-source (glucose / maltodextrin) | Standard gut absorption |
| 61 - 90 g/hr | Dual-source 2:1 glucose:fructose required | GLUT5 fructose transporter needed above 60 g/hr |
| 91 - 120 g/hr | Maximum dual-source; trained gut required | Build tolerance over 4-6 weeks |
| >120 g/hr | Error - blocked at input | Exceeds physiological ceiling |
Above 90 g/hr, a safety warning fires. If the recommended rate calculation produces a result above 120 g/hr, the output is capped at 120 and an absorption ceiling warning is displayed.
The absorption science underlying these tiers comes from Jeukendrup's intestinal transporter research: the SGLT1 transporter saturates at ~60 g/hr for glucose/maltodextrin. Adding fructose (absorbed via GLUT5, a separate transporter) allows total absorption to reach approximately 90 g/hr with moderate gut training and up to 120 g/hr in well-trained athletes.
Fueling Start Delays
The fueling timeline applies a start delay before counting absorbed carbohydrate:
- Running: 15 minutes post-start before fueling begins
- Cycling: 20 minutes post-start
This reflects practical race-start conditions (settling in, sipping water only) and the time needed for gastric emptying of the first serving. The timeline then calculates per-checkpoint totals assuming one 25g serving every (25 / fuelingRate) x 60 minutes.
Safety Guards
The calculator fires four conditional safety warnings:
-
Absorption ceiling applied - raw recommended fueling exceeds 120 g/hr. Displayed when the recommendation is mathematically infeasible and has been capped.
-
Extreme fueling rate - input fueling above 90 g/hr. Warns of GI distress risk and the need for progressive gut training.
-
Ultra-endurance note - event duration above 6 hours with fueling above 60 g/hr. Gastric emptying slows during prolonged exercise; recommends reducing fueling target by 10-15 g/hr in later stages.
-
Glycogen depletion predicted before finish (critical) - when
distanceToWall < targetDistKm. Shows predicted depletion distance, the shortfall versus target, and the minimum required fueling rate.
Limitations
Carb fraction overestimation at low intensity. The linear formula 0.15 + 1.1 × fractionVO2max produces carbFraction = 0.70 at 50% VO2max, which is higher than the crossover literature's ~0.50 at that intensity. The formula becomes accurate above approximately 60% VO2max - the range relevant for most race efforts.
"Tank draining" model. The calculator treats glycogen as a simple depleting reservoir at a constant rate. Rapoport's original model included a feedback loop: as glycogen runs low, fat oxidation increases and the depletion rate slows. Without this feedback, the model may slightly overestimate the sharpness of the wall. The real transition is gradual - performance degrades progressively as stores fall, not as a binary on/off.
Steady-state assumption. Pace variations, climbs, race surges, and drafting all alter instantaneous substrate partitioning. A surge at 95% VO2max burns carbohydrate much faster than the average intensity predicts.
Cycling speed model is flat-road only. CdA = 0.32 assumes a road bike position; CRR = 0.005 assumes paved surface. Hilly terrain, headwind, or different equipment changes speed and therefore event duration.
VO2 equations have measurement error. The ACSM running equation (VO2 = speed × 0.2 + 3.5) was derived from treadmill ergometry and assumes horizontal running at constant speed. The ACSM cycle equation assumes constant-load cycle ergometry. Both carry standard errors of several mL/kg/min in real-world conditions.
Glycogen stores are fixed estimates. The 1,600/2,200/2,800 kcal tiers are population-level approximations. Actual stores depend on the athlete's muscle mass, muscle fiber type composition (Type I fibers store more glycogen), starting training status, and the completeness of carbohydrate loading. An individual's actual stores may differ by 15-25%.
Gut tolerance is not modeled. The fueling rate inputs and recommendations do not account for individual GI sensitivity, hydration status, or the hypertonic load effect of combining gels with sports drink rather than water.
🚨 CRITICAL SAFETY WARNING
This calculator involves conditions that can cause serious injury or life-threatening complications if misapplied. Consult a physician before use.
ℹ️ IMPORTANT DISCLAIMER
This calculator is for educational purposes only and does NOT constitute medical advice. Consult qualified professionals before making changes. Individual physiology varies. You assume all risk. Must be 18+.
References
-
Rapoport, B. I. (2010). Metabolic factors limiting performance in marathon runners. PLOS Computational Biology, 6(10), e1000960. https://doi.org/10.1371/journal.pcbi.1000960
-
Coyle, E. F. (2007). Physiological regulation of marathon performance. Sports Medicine, 37(4-5), 306-311.
-
Karlsson, J., & Saltin, B. (1971). Diet, muscle glycogen, and endurance performance. Journal of Applied Physiology, 31(2), 203-206.
-
Bergstrom, J., Hermansen, L., Hultman, E., & Saltin, B. (1967). Diet, muscle glycogen and physical performance. Acta Physiologica Scandinavica, 71(2), 140-150.
-
Jeukendrup, A. E. (2014). A step towards personalized sports nutrition: carbohydrate intake during exercise. Sports Medicine, 44(S1), 25-33.
-
Brooks, G. A., & Mercier, J. (1994). Balance of carbohydrate and lipid utilization during exercise: the "crossover" concept. Journal of Applied Physiology, 76(6), 2253-2261.
-
American College of Sports Medicine. (2006). ACSM's Guidelines for Exercise Testing and Prescription (7th ed.). Lippincott Williams & Wilkins.
-
Buman, M. P., Brewer, B. W., Cornelius, A. E., Van Raalte, J. L., & Petitpas, A. J. (2008). Hitting the wall in the marathon: phenomenological characteristics and associations with expectancy, gender, and running history. Psychology of Sport and Exercise, 9(4), 507-526.
Scientific Validation Notes
Glycogen store tiers (1,600 / 2,200 / 2,800 kcal)
These fixed values approximate total carbohydrate availability (muscle + liver glycogen) at three loading levels. The range 1,600-2,800 kcal is consistent with Rapoport (2010), which modeled muscle glycogen density at 80 kcal/kg (depleted) to 144 kcal/kg (carbohydrate-loaded) for leg muscle mass of 15-20% of body weight, plus approximately 400 kcal liver glycogen. The values are population-level estimates independent of body weight in this calculator - a simplification that introduces error for athletes significantly above or below 70 kg.
Energy expenditure conversion factor (4.85 kcal/L O2)
The code uses 4.85 kcal per litre of O2. The physiologically correct value ranges from 4.69 kcal/L (pure fat oxidation) to 5.05 kcal/L (pure carbohydrate), with 4.85 representing a mixed-substrate RQ of approximately 0.88. This is a reasonable fixed value for moderate-to-high intensity sustained exercise.
Carbohydrate fraction formula
The linear formula carbFraction = 0.15 + 1.1 × fractionVO2max is an approximation of the crossover concept. At 70% VO2max it yields carbFraction = 0.92, consistent with the upper range reported in the literature for trained athletes at marathon race intensity. The formula overestimates carbohydrate contribution below about 50% VO2max (predicts 0.70 vs the literature's ~0.50 at that intensity). For the calculator's target use case - race efforts above 65% VO2max - the approximation is fit for purpose.
Cycling speed model
The Newton-Raphson solution to the power equation uses g = 9.81 m/s² (correct SI value). The modeled CdA of 0.32 represents a mid-position road bike; actual CdA for a TT position is closer to 0.22, and for an upright position it may reach 0.40+. The model is accurate enough for pacing estimation on flat courses but should not be used to predict power-speed relationships on hilly or technical terrain.
Absorption ceiling at 120 g/hr
The 120 g/hr ceiling is consistent with the highest published absorption rates for well-trained athletes using multiple-transporter carbohydrate blends (glucose + fructose). Most athletes absorb 60-90 g/hr without gut training. The ceiling is enforced as a hard input block - entering more than 120 g/hr returns an error rather than producing a result, which is the correct safety behaviour.