Heat & Humidity Adjustment
The Science Behind It
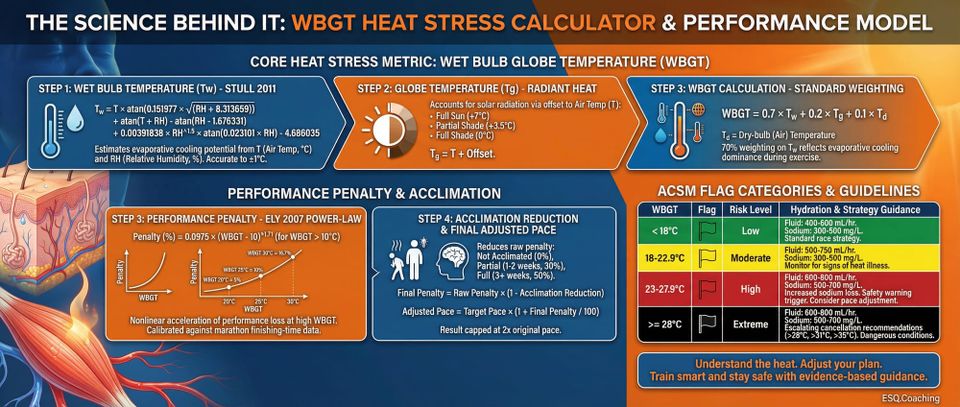
How the Calculator Works
The calculator uses WBGT (Wet Bulb Globe Temperature) as its core heat stress metric - the same standard used by ACSM and World Athletics for race cancellation decisions. Rather than treating temperature and humidity as independent additive factors, it models how they interact through their combined effect on the body's ability to cool itself.
Step 1: Wet Bulb Temperature (Stull 2011)
The calculator first estimates wet bulb temperature from your air temperature and relative humidity using the Stull (2011) approximation:
Tw = T × atan(0.151977 × √(RH + 8.313659)) + atan(T + RH) - atan(RH - 1.676331) + 0.00391838 × RH1.5 × atan(0.023101 × RH) - 4.686035
Where T is air temperature in Celsius and RH is relative humidity (%). This formula is accurate to within ±1°C for RH 5-99% and temperatures -20°C to 50°C.
Step 2: Globe Temperature and WBGT
Globe temperature (Tg) accounts for radiant heat from the sun. The calculator adds a solar offset to air temperature:
- Full sun: +7°C
- Partial shade: +3.5°C
- Full shade: 0°C
WBGT is then calculated using the standard weighting formula:
WBGT = 0.7 × Tw + 0.2 × Tg + 0.1 × Td
Where Tw is wet bulb temperature, Tg is globe temperature, and Td is dry-bulb (air) temperature. The 70% weighting on wet bulb reflects that evaporative cooling dominates thermoregulatory strain during exercise.
Step 3: Performance Penalty (Ely 2007 Power-Law)
The performance penalty is a power-law fit to marathon finishing-time data from Ely et al. (2007):
penalty (%) = 0.0975 × (WBGT - 10)1.71 (when WBGT > 10°C; otherwise 0%)
This model is calibrated against the Ely dataset: WBGT 20°C yields ~5% penalty, WBGT 25°C yields ~10%, WBGT 30°C yields ~16.7%. The power-law curve captures the nonlinear acceleration of performance loss at high WBGT - conditions become dramatically worse, not just proportionally worse.
Step 4: Acclimation Reduction
Heat acclimation reduces the raw penalty:
- Not acclimated: 0% reduction (full penalty)
- Partial (1-2 weeks): 30% reduction
- Full (3+ weeks): 50% reduction
Final penalty = raw penalty × (1 - acclimation reduction)
Step 5: Adjusted Pace
Adjusted pace = target pace × (1 + final penalty / 100)
The result is capped at 2x the original pace to prevent absurd outputs under extreme inputs.
ACSM Flag Categories
The WBGT output maps directly to the ACSM/World Athletics flag system:
| WBGT | Flag | Risk Level |
|---|---|---|
| < 18°C | Green | Low |
| 18-22.9°C | Yellow | Moderate |
| 23-27.9°C | Red | High |
| >= 28°C | Black | Extreme |
The calculator displays race strategy guidance and hydration targets for each band. Fluid intake guidance follows ACSM recommendations: 400-600 mL/hr (Green), 500-750 mL/hr (Yellow), 600-800 mL/hr (Red/Black). Sodium targets shift from 300-500 mg/L to 500-700 mg/L above WBGT 23°C to counter sweat sodium losses. Safety warnings trigger at WBGT >23°C, with escalating cancellation recommendations above 28°C, 31°C, and 35°C.
Worked Example
A runner targeting 4:00/km on a 28°C day, 70% humidity, full sun, not acclimated:
Wet bulb (Stull): Tw ≈ 26.4°C
Globe temperature: Tg = 28 + 7 = 35°C
WBGT: 0.7 × 26.4 + 0.2 × 35 + 0.1 × 28 = 18.5 + 7.0 + 2.8 = 28.3°C (Black flag)
Penalty: 0.0975 × (28.3 - 10)1.71 = 0.0975 × 18.31.71 ≈ 17.2%
Adjusted pace: 4:00 × 1.172 = 4:41/km
Compare that to the same conditions in full shade: Tg = 28°C, WBGT ≈ 25.5°C (Red flag), penalty ≈ 11.8%, adjusted pace ≈ 4:28/km. Sun exposure is not a minor factor.
Practical Application
-
Marathon race day planning: You trained through winter and your goal marathon falls on a warm spring day. Rather than going out at your planned 3:15 marathon pace and imploding at mile 20, you enter the conditions and get a realistic target - including the ACSM flag that tells you whether to race aggressively or just finish safely.
-
Summer training calibration: Easy runs in July feel sluggish compared to spring fitness. This calculator confirms that your 5:30/km pace in 30°C heat at 80% humidity (WBGT ~27°C) represents substantially harder physiological work than that pace in cool conditions. Your fitness has not evaporated.
-
Acclimation planning: Heading to a hot-weather race after training in cool conditions? The acclimation inputs quantify the benefit of arriving early to acclimatize - and how much performance you leave on the table if you do not.
-
Race venue selection: Choosing between a September marathon in a warm coastal city versus a cool mountain course? Plug in typical conditions for each. The WBGT model captures why a humid 22°C day at sea level can feel worse than a dry 26°C day.
Why This Matters
Every runner who has raced on a hot day knows the feeling: the pace that felt easy in training suddenly becomes unsustainable. But how much should you actually slow down? The answer matters for two distinct reasons. Under-adjustment leads to a blown race or, in severe heat, a medical emergency. Over-adjustment on a merely warm day wastes the fitness you built.
The WBGT model answers this question more accurately than simple temperature-based rules because it captures the critical interaction between temperature and humidity. A 30°C day at 30% humidity (WBGT ~22°C) is far less stressful than 30°C at 90% humidity (WBGT ~30°C). Air temperature alone cannot distinguish between those two scenarios.
The Research
The foundational study behind this calculator is Ely et al. (2007), published in Medicine & Science in Sports & Exercise. This was a large epidemiological analysis of marathon performance data spanning seven major North American marathons (Boston, New York City, Twin Cities, Grandma's, Richmond, Hartford, and Vancouver) across 6 to 36 years per race - one of the largest datasets ever assembled on weather and endurance performance.
Study Design
Ely and colleagues at the U.S. Army Research Institute of Environmental Medicine obtained finishing times and same-day weather data for each race. They used Wet Bulb Globe Temperature (WBGT) as their environmental stress metric - a composite measure that integrates dry-bulb temperature, humidity, wind speed, and solar radiation. Race results were stratified into four WBGT quartiles:
- Q1: 5.1-10.0°C (cool)
- Q2: 10.1-15.0°C (mild)
- Q3: 15.1-20.0°C (warm)
- Q4: 20.1-25.0°C (hot)
Key Findings
Performance was analyzed at multiple finishing positions (top 3, 25th, 50th, 100th, and 300th place) for both men and women. The central finding was a progressive and ability-dependent slowdown:
| Finishing Position | Slowdown per 5°C WBGT Increase |
|---|---|
| Top 3 | ~0.9% |
| 25th place | ~1.1% |
| 50th place | ~1.5% |
| 100th place | ~1.8% |
| 300th place | ~3.2% |
Top male finishers were slower than course record by 1.7 +/- 1.5%, 2.5 +/- 2.1%, 3.3 +/- 2.0%, and 4.5 +/- 2.3% for Q1 through Q4. Women showed a similar pattern (Q1: 3.2 +/- 4.9%, Q2: 3.2 +/- 2.9%, Q3: 3.8 +/- 3.2%, Q4: 5.4 +/- 4.1%).
The dose-response accelerates with increasing WBGT - the power-law fit used in this calculator captures that nonlinearity better than a linear approximation.
Limitations
-
WBGT is estimated, not measured. Real WBGT requires a stationary black globe thermometer and anemometer. This calculator approximates globe temperature by adding a fixed solar offset (7°C for full sun) to air temperature. Field measurements show the offset can reach 10-25°C depending on cloud cover, surface albedo, and wind speed. In direct sunlight, actual WBGT may run 1-3°C higher than the calculator estimates.
-
Individual variation is large. Ely's data showed that slower runners suffer disproportionately more in heat. The power-law model is fitted to aggregate marathon data across ability levels - it is a population average, not a personalized prediction. Some athletes are more heat-tolerant than others regardless of acclimation status.
-
Acclimation reductions are approximate. The 30% and 50% reductions for partial and full acclimation are informed by Periard et al. (2015) but are not precise for any individual. Heat acclimation protocols vary substantially in duration, intensity, and method.
-
Running-only data. Ely's dataset is marathon finishing times. The calculator provides pace adjustments for running. Power output adjustments for cycling in heat follow different physiological dynamics and are not covered here.
-
The study captured race-day behavior, not isolated physiology. Some of the observed performance decrement reflects conservative pacing decisions by runners, not purely physiological limitation. The two effects are difficult to separate in field data.
-
WBGT above 25°C is extrapolated. Ely's quartile analysis only extends to WBGT 25°C. The power-law model extrapolates beyond that range. At extreme WBGT (>28°C), performance degradation is severe enough that the practical question shifts from pace adjustment to whether to race at all.
🚨 CRITICAL SAFETY WARNING
This calculator involves conditions that can cause serious injury or life-threatening complications if misapplied. Consult a physician before use.
ℹ️ IMPORTANT DISCLAIMER
This calculator is for educational purposes only and does NOT constitute medical advice. Consult qualified professionals before making changes. Individual physiology varies. You assume all risk. Must be 18+.
References
-
Ely, M. R., Cheuvront, S. N., Roberts, W. O., & Montain, S. J. (2007). Impact of weather on marathon-running performance. Medicine & Science in Sports & Exercise, 39(3), 487-493. https://doi.org/10.1249/mss.0b013e31802d3aba
-
Ely, M. R., Cheuvront, S. N., & Montain, S. J. (2007). Neither cloud cover nor low solar loads are associated with fast marathon performance. Medicine & Science in Sports & Exercise, 39(11), 2029-2035.
-
Stull, R. (2011). Wet-bulb temperature from relative humidity and air temperature. Journal of Applied Meteorology and Climatology, 50(11), 2267-2269. https://doi.org/10.1175/JAMC-D-11-0143.1
-
Armstrong, L. E., Casa, D. J., Millard-Stafford, M., Moran, D. S., Pyne, S. W., & Roberts, W. O. (2007). American College of Sports Medicine position stand: Exertional heat illness during training and competition. Medicine & Science in Sports & Exercise, 39(3), 556-572.
-
Periard, J. D., Racinais, S., & Sawka, M. N. (2015). Adaptations and mechanisms of human heat acclimation. Scandinavian Journal of Medicine & Science in Sports, 25(S1), 52-64.
-
Sawka, M. N., Burke, L. M., Eichner, E. R., Maughan, R. J., Montain, S. J., & Stachenfeld, N. S. (2007). American College of Sports Medicine position stand: Exercise and fluid replacement. Medicine & Science in Sports & Exercise, 39(2), 377-390.