Lactate Threshold Curve Calculator
Entering Data Into the Calculator
For best results:
- Include the baseline stage (often 0 W or very low power).
- Intensities must be strictly increasing.
- Lactate must be positive.
- Heart rate is optional but improves interpretation.
Paste format:
power lactate hr
0 1.0 95
120 1.2 115
150 1.4 130...
Decimal commas are supported.
Using This Calculator Over Time
The main value is trend tracking, not one-off precision.
Use the Excel export to:
- Compare curves from different dates.
- Track shifts in baseline lactate.
- See whether inflection points move to higher power.
- Assess whether the curve becomes flatter at sub-threshold intensities.
Repeat tests under identical conditions whenever possible.
Final Note
This calculator intentionally shows multiple definitions at once. No single method is universally correct. When the test is well executed, several independent methods converge. When they do not, the data is telling you something about test quality or physiology.
That signal is the point.
And yes: you earned the “epic” label on this one - lactate tests are tough going!
If you want to see what I read to keep my own work sharp outside this newsletter, this is the list.

Required Equipment
Minimum:
- An indoor trainer or bike setup with reliable power measurement.
- A blood lactate analyser (e.g. Lactate Pro 2).
- Compatible lactate strips (plan 9–13 per test).
- Safety lancets (28G works well; larger gauge if new).
- Alcohol swabs, tissues, towel.
- Timer.
- Something to record values if not entering them live.
Strongly recommended:
- Erg-mode software to lock power per stage (or treadmill)
- A helper to take samples.
- Disposable non-latex gloves for the helper.
How to Take a Lactate Sample (Critical)
Most erroneous readings come from contamination, not physiology.
Follow this sequence exactly:
- Prepare before the stage ends
- Insert strip into analyser.
- Open alcohol swab.
- Uncap lancet.
- Do not touch either end of the strip.
- Clean the sampling area
- Wipe sweat aggressively from finger/earlobe and nearby skin.
- Alcohol swab the site.
- Let it dry fully.
- Prick and discard
- Prick the side of the fingertip or earlobe.
- Wipe away the first blood drop completely.
- Sample
- Gently form a second rounded drop.
- Do not squeeze hard.
- Touch the strip to the blood only, not the skin.
- Record
- Wait for the analyser result.
- Record lactate, power, and heart rate immediately.
If a value jumps by more than ~2 mmol/L between adjacent stages, repeat the sample (unless the test is nearing its end)
Pre-Test Nutrition (Non-Negotiable)
Lactate is sensitive to recent intake.
- No calories for at least 60 minutes before testing.
- No carbohydrate during the test.
- Water or sugar-free drinks only.
- Replicate pre-test nutrition across repeated tests.
Failure here mainly shifts baseline and low-intensity lactate, which breaks Baseline + Δ and log-based methods.
Recommended Aerobic Lactate Test Protocol
Protocol: Incremental Ramp Test (Home-Compatible)
Purpose:
- Characterise the full lactate curve.
- Estimate LT1- and LT2-related markers.
- Track changes over time.
Duration:
- ~60 minutes plus cool-down.
Stages:
- 6 minutes per stage (do not shorten).
- Lactate sampled at ~5 minutes.
- Power held constant per stage.
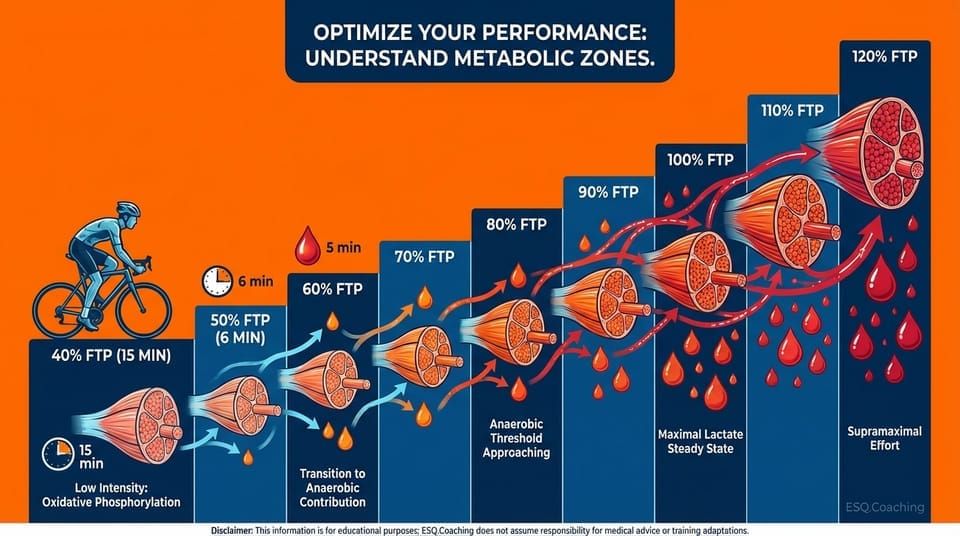
Warm-up:
- 15 minutes at very low intensity (~40 % FTP).
- Take one lactate sample near the end.
This defines baseline.
Ramp:
- Increase power by ~10 % FTP per stage.
- Continue until:
- lactate > 7-8 mmol/L, or
- HR > 95 % max.
Stop the test at that point.
Notes:
- Erg mode strongly preferred.
- Stay seated or standing consistently.
- If self-sampling, pausing briefly at the end of each stage is acceptable when stages are long enough.
The Science Behind It
How the Calculator Works
The LTC Calculator implements 14 distinct numerical methods for threshold detection. Users input power (or pace) and corresponding blood lactate values from an incremental step test, optionally including heart rate.
Core Algorithm Steps
-
Data input. A minimum of 4 test stages (power/pace and lactate pairs) are required. More stages (6-8) improve curve-fitting accuracy. Each stage represents 3-5 minutes of steady-state exercise followed by blood lactate sampling.
-
Baseline lactate determination. Resting lactate is established from the first stage or explicitly entered. Baseline shift correction can account for elevated pre-test lactate if needed (e.g., due to warm-up intensity or incomplete recovery).
-
Polynomial curve fitting. A polynomial model (user-selectable order: 2nd, 3rd, or 4th) is fit to the power-lactate data using least-squares regression. The polynomial provides a smooth, differentiable function for threshold detection: La(P) = a₀ + a₁P + a₂P² + ... + aₙPⁿ.
-
Threshold detection via multiple methods:
Geometric methods:
- Dmax: Point of maximal perpendicular distance from the line connecting first and last test points.
- ModDmax: Modified Dmax using only the rising portion of the curve to avoid final-stage bias.
- Log-Log Dmax: Dmax applied in log-transformed space, linearizing exponential lactate kinetics.
Derivative methods:
- First Derivative (Inflection Point): Power where dLa/dP is maximal (steepest lactate rise).
- Second Derivative (Curvature): Power where d²La/dP² = 0, marking the transition from concave to convex curvature.
Fixed lactate methods:
- LT 2.0 mmol/L: Power at 2.0 mmol/L lactate (LT1 estimate, aerobic threshold).
- LT 4.0 mmol/L: Power at 4.0 mmol/L lactate (classic LT2 estimate, OBLA).
- Custom lactate threshold: User-defined lactate concentration for individualized analysis.
Interpolation methods:
- Linear interpolation: Threshold estimated by linear interpolation between adjacent test stages when polynomial fitting is not desired.
- Cubic spline interpolation: Smooth piecewise cubic curve through data points, preserving continuity of first and second derivatives.
Heart rate methods:
- HR-lactate polynomial model: Polynomial fit to HR-lactate data, enabling HR-based threshold estimation for field use.
- HR threshold solver: Inverse polynomial solver to find power corresponding to a target lactate or HR value.
Advanced methods:
- Baseline shift correction: Adjusts all lactate values by subtracting elevated resting lactate, normalizing the curve.
- Pace-to-power conversion: Converts running pace data to equivalent power using standard metabolic equations for cross-modality comparison.
-
Comparison output. The calculator displays threshold estimates from all selected methods side-by-side, allowing the user to assess convergence or identify outliers. Consensus across multiple methods (e.g., Dmax, ModDmax, and 4 mmol/L within 5-10W) increases confidence in the threshold estimate.
-
Visualization. A graph plots the raw lactate data points, the fitted polynomial curve, and threshold markers from each method, enabling visual validation of curve quality and threshold plausibility.
Practical Application
Scenario 1: Trained cyclist (incremental ramp test, 25W/4min stages)
| Power (W) | Lactate (mmol/L) |
|---|---|
| 150 | 1.2 |
| 175 | 1.4 |
| 200 | 1.6 |
| 225 | 2.0 |
| 250 | 2.8 |
| 275 | 4.2 |
| 300 | 6.8 |
| 325 | 9.5 |
Results:
- Dmax LT2: ~268W
- ModDmax LT2: ~272W
- 4.0 mmol/L LT2: ~275W
- Polynomial inflection (LT2): ~270W
- Consensus LT2: ~270-275W (3.6-3.7 W/kg for a 75kg rider)
Training prescription: LT1 (2.0 mmol/L) occurs at ~225W. Zone 1 (below LT1): <225W. Zone 2 (LT1-LT2): 225-270W. Zone 3 (above LT2): >270W. Sweet-spot training targets 235-255W (88-94% of LT2).
Scenario 2: Recreational runner (pace-lactate test, 0.5 km/h increments, 5-min stages)
| Pace (min/km) | Lactate (mmol/L) |
|---|---|
| 7:00 | 1.5 |
| 6:30 | 1.8 |
| 6:00 | 2.2 |
| 5:30 | 3.1 |
| 5:00 | 5.0 |
| 4:30 | 8.2 |
Results:
- Dmax LT2: ~5:15/km
- 4.0 mmol/L LT2: ~5:05/km
- ModDmax LT2: ~5:12/km
- Consensus LT2: ~5:10/km
Training prescription: Easy runs <6:00/km (below LT1). Tempo runs 5:45-5:15/km (between LT1 and LT2). Threshold intervals near 5:10/km (at LT2). VO2max intervals <5:00/km (above LT2).
Why This Matters
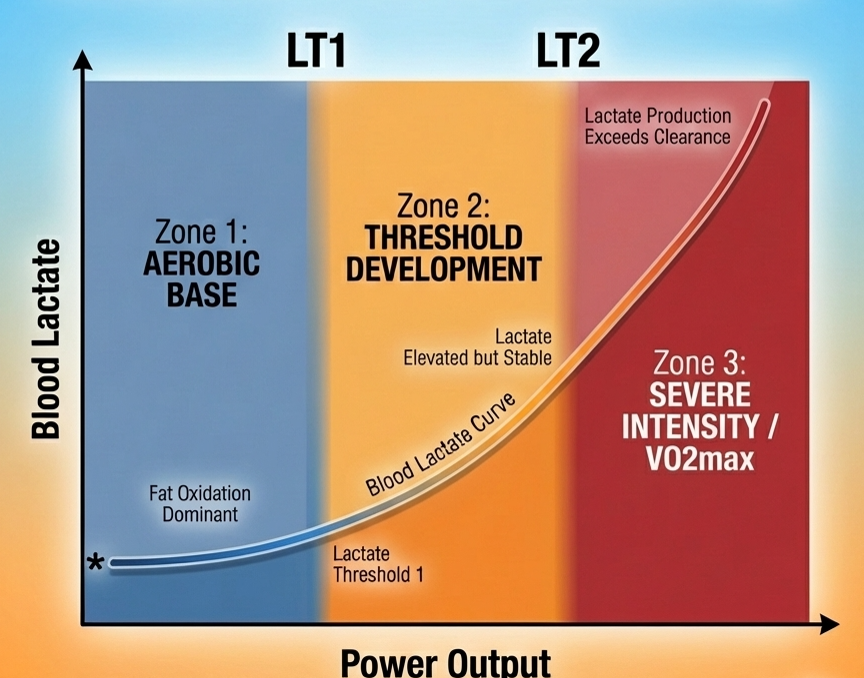
Blood lactate testing is the gold standard for identifying training zones and metabolic thresholds. Raw lactate data is just a table of numbers until it is analyzed. The Lactate Threshold Curve (LTC) Calculator transforms incremental step-test data into actionable training prescriptions. By modeling the power-lactate or heart rate-lactate relationship, it identifies critical metabolic breakpoints - the first lactate threshold (LT1/aerobic threshold) and second lactate threshold (LT2/anaerobic threshold) - that define your physiological training zones.
These thresholds are essential for optimizing training intensity distribution. Elite endurance athletes spend approximately 80% of training time below LT1, with high-intensity work targeted near or above LT2 (Seiler & Kjerland, 2006). Without accurate threshold identification, athletes risk training too hard during easy sessions (accumulating excess fatigue) and too easy during hard sessions (insufficient stimulus for adaptation).
The Research
Lactate Threshold Concepts. The lactate curve is not a single threshold but a continuum of metabolic states. Skinner & McLellan (1980) identified two distinct breakpoints: LT1 marks the intensity where lactate begins to accumulate above resting levels, while LT2 represents the maximal lactate steady state - the highest intensity sustainable without progressive lactate accumulation. These correspond closely to the ventilatory thresholds VT1 and VT2 measured via gas exchange.
Dmax Method (Cheng et al., 1992). The Dmax algorithm identifies LT2 as the point on the lactate curve that is maximally distant from the straight line connecting the first and last test points. This geometric approach assumes that the lactate curve accelerates at LT2, creating maximal divergence from the baseline trend. Cheng validated this method against the 4 mmol/L fixed-lactate threshold and found excellent agreement in trained cyclists.
Modified Dmax (Newell et al., 2007). Recognizing that Dmax can be influenced by the final test stage (which may exceed sustainable intensity), Newell proposed ModDmax. This variant uses the polynomial lactate model to identify the point of maximal perpendicular distance from the baseline, providing a more robust estimate when the final stage induces severe lactate accumulation.
Polynomial Curve Fitting. Lactate accumulation follows a sigmoidal or exponential pattern, not a simple linear relationship. Polynomial regression (typically 2nd or 3rd order) provides a smooth mathematical model of the power-lactate curve, enabling interpolation between discrete test stages and derivative analysis to find inflection points. The polynomial model minimizes the sum of squared residuals between observed and predicted lactate values.
Log-Log Transformation (Bishop et al., 1998). Some researchers model lactate kinetics using logarithmic transformations, which linearize exponential lactate accumulation patterns. The log-log model assumes lactate accumulation follows a power law: log(La) = a + b × log(Power). This transformation can improve threshold detection when the lactate curve exhibits exponential rather than polynomial characteristics.
Heart Rate-Lactate Coupling. When heart rate data is available, modeling the HR-lactate relationship enables threshold identification from HR alone in subsequent field sessions. The HR-lactate coupling is typically sigmoid, with HR rising linearly until LT1, then accelerating beyond LT2 as sympathetic drive intensifies and stroke volume plateaus.
Fixed Lactate Thresholds. Historical approaches used fixed lactate concentrations (e.g., 2 mmol/L for LT1, 4 mmol/L for LT2/OBLA). However, individual lactate kinetics vary considerably with training status, muscle fiber type, and glycolytic capacity. Fixed thresholds often misclassify LT2 in highly trained or untrained individuals (Faude et al., 2009). Modern methods prefer individualized curve-fitting approaches.
Limitations
-
Requires laboratory blood lactate testing. This calculator is only useful if you have access to incremental lactate testing, which requires finger-prick blood sampling every 3-5 minutes during a ramp test. Portable lactate analyzers (e.g., Lactate Plus, Lactate Scout) cost $200-500. Without lactate data, surrogate methods (ventilatory threshold, talk test, heart rate deflection, or field time trials) must be used instead.
-
Test protocol affects threshold estimates. Stage duration (3 vs. 5 minutes), step size (20W vs. 30W), and pre-test nutrition/hydration all influence lactate kinetics. Shorter stages (<3 minutes) underestimate threshold because lactate has not reached steady-state; longer stages (>6 minutes) allow greater lactate clearance and may overestimate threshold. Standardized protocols (4-minute stages) improve test-retest reliability.
-
Different methods can yield different thresholds. The 14 methods in this calculator represent competing models of lactate kinetics. Disagreement between methods (e.g., Dmax at 270W but 4 mmol/L at 285W) reflects genuine uncertainty in threshold identification, often due to data noise or ambiguous curve shape. Consensus across multiple methods increases confidence, but no single method is universally superior across all lactate curve morphologies.
-
Polynomial order affects curve shape and threshold estimates. A 2nd-order polynomial may underfit complex lactate curves with multiple inflections or delayed exponential rise. A 4th-order polynomial may overfit, creating spurious oscillations between data points. The optimal polynomial order depends on data quality, number of test stages, and curve smoothness. Visual inspection of the fitted curve is essential to detect overfitting artifacts.
-
Lactate threshold is not static. LT1 and LT2 shift with training adaptations, detraining, altitude, heat, glycogen depletion, and acute fatigue. A single test provides a snapshot, not a permanent value. Retesting every 8-12 weeks tracks training progress and recalibrates zones. Day-to-day variability of 5-10W is normal even with standardized protocols.
-
Fixed lactate thresholds (2 mmol/L, 4 mmol/L) are population averages. Individual lactate kinetics vary considerably. Elite athletes with high oxidative capacity and lactate clearance often reach 4 mmol/L at intensities 10-15% below their true maximal lactate steady state. Conversely, untrained individuals or those with high fast-twitch fiber percentage may exceed 4 mmol/L well before reaching sustainable threshold intensity. Individualized curve-fitting methods (Dmax, ModDmax) are preferred for personalized threshold detection.
-
Heart rate-lactate models assume stable HR-lactate coupling. Cardiac drift (progressive HR rise at constant power due to dehydration and rising core temperature), beta-blocker medication, heat stress, and autonomic fatigue can decouple HR from lactate production. HR-based threshold predictions are valid only when HR-lactate coupling is stable, typically in controlled laboratory conditions with adequate hydration and thermoregulation.
-
Baseline lactate plausibility. The calculator flags baseline (resting) lactate values below 0.5 mmol/L or above 3.0 mmol/L. Typical resting blood lactate is 0.5–2.0 mmol/L. A value below 0.5 may indicate a measurement error, while a value above 3.0 suggests the athlete was not adequately rested before the test protocol began, which will shift all subsequent threshold estimates higher.
ℹ️ IMPORTANT DISCLAIMER
This calculator is for educational purposes only and does NOT constitute medical advice. Consult qualified professionals before making changes. Individual physiology varies. You assume all risk. Must be 18+.
References
Skinner, J. S., & McLellan, T. H. (1980). The transition from aerobic to anaerobic metabolism. Research Quarterly for Exercise and Sport, 51(1), 234--248. https://doi.org/10.1080/02701367.1980.10609285
Cheng, B., Kuipers, H., Snyder, A. C., Keizer, H. A., Jeukendrup, A., & Hesselink, M. (1992). A new approach for the determination of ventilatory and lactate thresholds. International Journal of Sports Medicine, 13(7), 518--522. https://doi.org/10.1055/s-2007-1021309
Newell, J., Higgins, D., Madden, N., Cruickshank, J., Einbeck, J., McMillan, K., & McDonald, R. (2007). Software for calculating blood lactate endurance markers. Journal of Sports Sciences, 25(12), 1403--1409. https://doi.org/10.1080/02640410601128922
Seiler, K. S., & Kjerland, G. O. (2006). Quantifying training intensity distribution in elite endurance athletes. European Journal of Applied Physiology, 98(2), 199--209. https://doi.org/10.1007/s00421-006-0254-x
Bishop, D., Jenkins, D. G., & Mackinnon, L. T. (1998). The relationship between plasma lactate parameters, Wpeak and 1-h cycling performance in women. Medicine & Science in Sports & Exercise, 30(8), 1270--1275. https://doi.org/10.1097/00005768-199808000-00014
Faude, O., Kindermann, W., & Meyer T. (2009). Lactate threshold concepts: how valid are they? Sports Medicine, 39(6), 469--490. https://doi.org/10.2165/00007256-200939060-00003