Lactate Threshold Calculator
How to Use It Properly
This calculator is designed to analyse blood lactate data from incremental cycling, swimming our running tests. Its accuracy depends entirely on how the test is executed and how the samples are taken.
The calculator computes multiple threshold definitions in parallel (OBLA, Baseline + Δ, Dmax variants, log-log breakpoints).
These methods are mathematically consistent but answer different questions. Agreement between methods improves only when the test protocol and sampling are well controlled.
What This Calculator Does (and Does Not Do)
What it does
- Fits a smooth lactate–pace/power curve to staged test data.
- Computes several commonly used lactate thresholds from that curve.
- Displays thresholds visually and exports the full dataset to Excel for longitudinal tracking.
What it does not do
- It does not correct for poor sampling technique.
- It does not compensate for short stages (less than 3 min) or unstable power (e.g. unstable running / cycling in field tests or in non-ERG setups).
- It does not “find the truth” if the protocol is flawed.
Garbage in still produces garbage out, just with nicer plots 😄 Therefore, we have included a how-to guide at the bottom of this page.
Entering Data Into the Calculator
For best results:
- Include the baseline stage (often 0 W or very low power).
- Intensities must be strictly increasing.
- Lactate must be positive.
- Heart rate is optional but improves interpretation.
Paste format:
power lactate hr
0 1.0 95
120 1.2 115
150 1.4 130...
Decimal commas are supported.
Using This Calculator Over Time
The main value is trend tracking, not one-off precision.
Use the Excel export to:
- Compare curves from different dates.
- Track shifts in baseline lactate.
- See whether inflection points move to higher power.
- Assess whether the curve becomes flatter at sub-threshold intensities.
Repeat tests under identical conditions whenever possible.
Final Note
This calculator intentionally shows multiple definitions at once. No single method is universally correct. When the test is well executed, several independent methods converge. When they do not, the data is telling you something about test quality or physiology.
That signal is the point.
And yes: you earned the “epic” label on this one - lactate tests are tough going!
If you want to see what I read to keep my own work sharp outside this newsletter, this is the list.

Required Equipment
Minimum:
- An indoor trainer or bike setup with reliable power measurement.
- A blood lactate analyser (e.g. Lactate Pro 2).
- Compatible lactate strips (plan 9–13 per test).
- Safety lancets (28G works well; larger gauge if new).
- Alcohol swabs, tissues, towel.
- Timer.
- Something to record values if not entering them live.
Strongly recommended:
- Erg-mode software to lock power per stage (or treadmill)
- A helper to take samples.
- Disposable non-latex gloves for the helper.
How to Take a Lactate Sample (Critical)
Most erroneous readings come from contamination, not physiology.
Follow this sequence exactly:
- Prepare before the stage ends
- Insert strip into analyser.
- Open alcohol swab.
- Uncap lancet.
- Do not touch either end of the strip.
- Clean the sampling area
- Wipe sweat aggressively from finger/earlobe and nearby skin.
- Alcohol swab the site.
- Let it dry fully.
- Prick and discard
- Prick the side of the fingertip or earlobe.
- Wipe away the first blood drop completely.
- Sample
- Gently form a second rounded drop.
- Do not squeeze hard.
- Touch the strip to the blood only, not the skin.
- Record
- Wait for the analyser result.
- Record lactate, power, and heart rate immediately.
If a value jumps by more than ~2 mmol/L between adjacent stages, repeat the sample (unless the test is nearing its end)
Pre-Test Nutrition (Non-Negotiable)
Lactate is sensitive to recent intake.
- No calories for at least 60 minutes before testing.
- No carbohydrate during the test.
- Water or sugar-free drinks only.
- Replicate pre-test nutrition across repeated tests.
Failure here mainly shifts baseline and low-intensity lactate, which breaks Baseline + Δ and log-based methods.
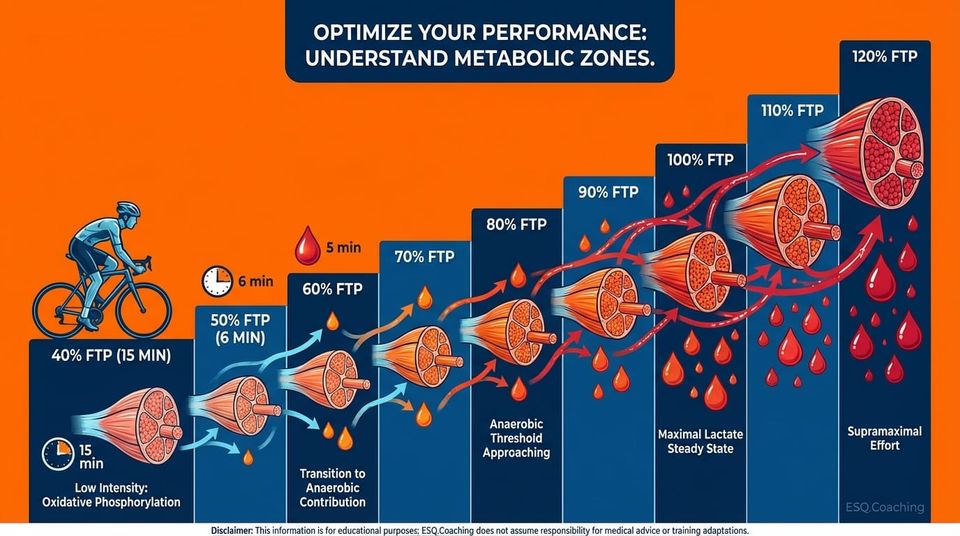
Recommended Aerobic Lactate Test Protocol
Protocol: Incremental Ramp Test (Home-Compatible)
Purpose:
- Characterise the full lactate curve.
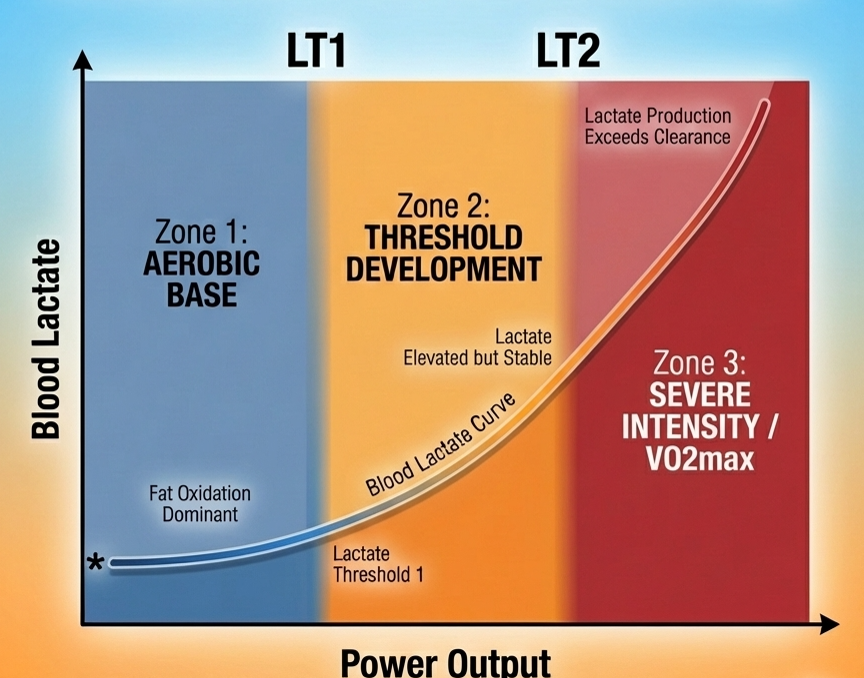
- Estimate LT1- and LT2-related markers.
- Track changes over time.
Duration:
- ~60 minutes plus cool-down.
Stages:
- 6 minutes per stage (do not shorten).
- Lactate sampled at ~5 minutes.
- Power held constant per stage.
Warm-up:
- 15 minutes at very low intensity (~40 % FTP).
- Take one lactate sample near the end.
This defines baseline.
Ramp:
- Increase power by ~10 % FTP per stage.
- Continue until:
- lactate > 7-8 mmol/L, or
- HR > 95 % max.
Stop the test at that point.

Notes:
- Erg mode strongly preferred.
- Stay seated or standing consistently.
- If self-sampling, pausing briefly at the end of each stage is acceptable when stages are long enough.
Interpreting the Results
The calculator reports several lactate thresholds. Each method encodes a different assumption about lactate kinetics and should not be treated as equivalent.
Fixed-value references (OBLA 2.0–4.0 mmol/L)
These thresholds apply an absolute lactate concentration criterion. They allow cross-athlete and cross-study comparison but do not account for individual baseline differences. Values shift with glycogen status, recent intensity, hydration, and sampling site. Best suited for population-level comparisons, not for fine-grained individual tracking.
Baseline + Δ methods
These define the threshold as a fixed increase above the first measured lactate value. The method assumes that the initial stage reflects true resting or low-intensity lactate.
If the baseline is elevated by warm-up intensity, prior training, or incomplete recovery, the entire curve is translated upward, biasing the result. When protocols and pre-test conditions are tightly controlled, this method tracks longitudinal change reliably.
Dmax / Modified Dmax
These methods identify the point of maximal perpendicular distance between the lactate curve and a reference line. The estimate depends on curve geometry rather than an absolute concentration.
This makes it less sensitive to baseline shifts and more stable at higher intensities. In practice, it often corresponds to the highest sustainable metabolic steady state rather than the first rise in lactate.
Log–log breakpoint
This method fits a piecewise model to log-transformed lactate and workload data and detects the first clear change in slope.
It targets the initial alteration in lactate kinetics rather than accumulation magnitude. Accurate detection requires clean low-intensity data with minimal noise. Zero or negative workloads cannot be included due to the logarithmic transform.
Interpretation rule
Convergence of multiple methods increases confidence that the protocol captured true physiological transitions. Large disagreement typically reflects issues in stage duration, sampling timing, baseline elevation, or analytical error rather than multiple “true” thresholds.
Common Pitfalls (and Their Effects)
- Short stages → underestimates thresholds.
- Unstable power → noisy curve, unreliable Dmax.
- Sweat contamination → artificially low lactate.
- Missing baseline stage → broken Baseline + Δ and log methods.
- Eating before test → elevated early lactate, false LT1.
Legal & Medical Disclaimer
The information provided in this newsletter is for educational purposes only and does not constitute medical advice, diagnosis, or treatment. Always seek the advice of your physician or other qualified health provider with any questions you may have regarding a medical condition or before starting any new fitness or nutrition regimen. The Scientist’s Notebook and ESQ Coaching are not liable for any injuries or damages that may occur from the application of the information contained herein.
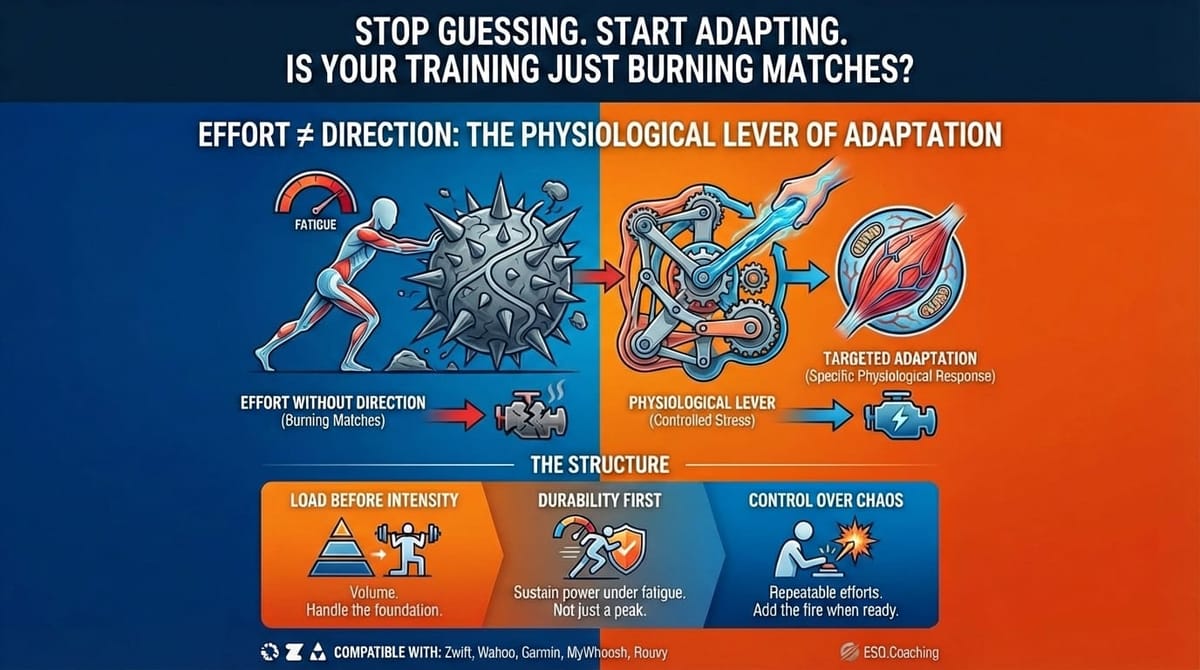
The plans you find here are built on a simple truth: Adaptation only happens when you apply the right stress, at the right time, in the right dose.
References
- Faude, O., Kindermann, W., & Meyer, T. (2009). Lactate threshold concepts:
How valid are they? Sports Medicine, 39(6), 469-490. - Beneke, R., Leithäuser, R. M., & Ochentel, O. (2011). Blood lactate diagnostics
in exercise testing and training. International Journal of Sports Physiology and
Performance, 6(1), 8-24. - Pfitzinger, P., & Latter, S. (2015). Advanced Marathoning. Human Kinetics.
- McNaughton, L. R., Siegler, J., & Midgley, A. (2008). The ergogenic effects of
sodium bicarbonate. Sports Medicine, 38(7), 495-512. - Heuberger JAAC, Gal P, Stuurman FE, de Muinck Keizer WAS, Mejia Miranda
Y, Cohen AF. Repeatability and predictive value of lactate threshold
concepts in endurance sports. PLoS One. 2018 Nov 14;13(11):e0206846. doi:
10.1371/journal.pone.0206846. PMID: 30427900; PMCID: PMC6235347.