Race Predictor
The Science Behind It
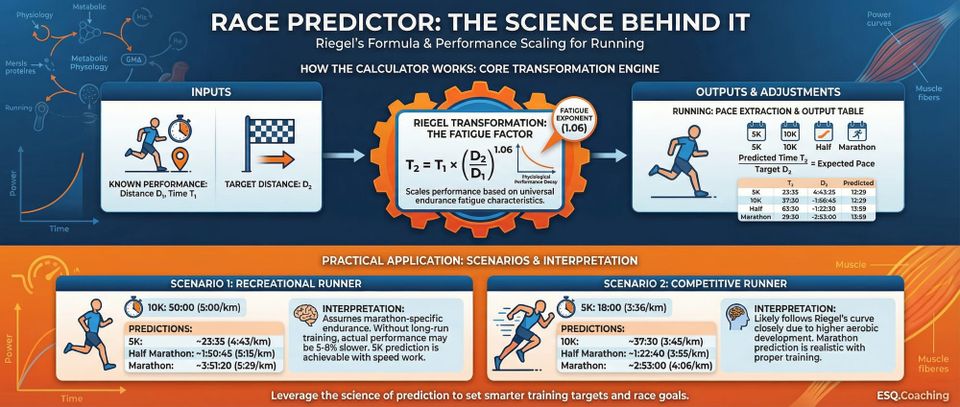
How the Calculator Works
-
Input: A known race distance and time (e.g., 10K in 42:00), plus a target race distance (e.g., half marathon).
-
Pace extraction: The known race time is converted to average pace (min/km or min/mile) to anchor the prediction.
-
Riegel transformation: The target distance D₂ is used with the source distance D₁ to compute the predicted time: T₂ = T₁ × (D₂/D₁)1.06.
-
Pace adjustment: The predicted time T₂ is divided by the target distance to yield the expected pace for that race.
-
Output table: The calculator generates predictions for a range of standard distances (5K, 10K, 15K, half marathon, 30K, marathon), each with time and average pace.
Practical Application
Scenario 1: Recreational runner with recent 10K time of 50:00
- Input: 10K at 50:00 (5:00/km pace)
- Predictions:
- 5K: ~23:35 (4:43/km)
- Half Marathon: ~1:50:45 (5:15/km)
- Marathon: ~3:51:20 (5:29/km)
- Interpretation: The marathon prediction assumes the runner has marathon-specific endurance. Without long-run training, actual performance may be 5-8% slower. The 5K prediction is achievable with appropriate speed work.
Scenario 2: Competitive runner with 5K PR of 18:00
- Input: 5K at 18:00 (3:36/km pace)
- Predictions:
- 10K: ~37:30 (3:45/km)
- Half Marathon: ~1:22:40 (3:55/km)
- Marathon: ~2:53:00 (4:06/km)
- Interpretation: This runner's performances likely follow Riegel's curve more closely due to higher aerobic development. Marathon prediction is realistic if supported by proper training.
Why This Matters
Athletes planning race schedules need to know whether their 10K time predicts a realistic marathon goal, or what half-marathon pace to expect based on a recent 5K. The Race Predictor uses validated mathematical models to estimate equivalent performance across running race distances, helping runners set evidence-based goals and pace strategies. Rather than guessing at target times or relying on anecdotal pacing rules, athletes can use established performance relationships derived from physiological principles and large-scale empirical data.
This tool is useful when transitioning from shorter to longer races (or vice versa), assessing whether training adaptations have changed the shape of your performance curve, or sanity-checking race goals before committing to a training block.
The Research
Riegel's Power Law Model (1981). Peter Riegel introduced the endurance performance relationship T₂ = T₁ × (D₂/D₁)b, where T represents time, D represents distance, and b is the fatigue exponent. Riegel's analysis of world records across distances from 800m to the marathon yielded b ≈ 1.06 for elite runners. This model captures the fundamental physiological principle that longer races require proportionally slower paces due to progressive fatigue, substrate depletion, and metabolic drift (Riegel, 1981).
The power-law form reflects the curvilinear relationship between distance and time: doubling the distance does not double the time (which would imply constant pace), nor does it follow a simple linear decrement. The exponent of 1.06 quantifies the additional cost of sustained effort - a 10K takes slightly more than double the 5K time, a marathon takes considerably more than double the half-marathon time.
Empirical Validation in Recreational Runners (Vickers & Vertosick, 2016). While Riegel's exponent was derived from world-record performances, Vickers & Vertosick analyzed 2,188 runners from the 2010-2013 New York City Marathon to test the model's applicability to recreational athletes. They found that the Riegel formula systematically overestimates marathon performance when extrapolating from shorter races, with prediction errors averaging 6-10% for mid-pack finishers. The error increases with race distance and decreases with runner ability - elite runners follow the 1.06 exponent more closely than recreational runners.
The authors proposed that sub-elite athletes experience greater relative fatigue at marathon distance due to lower fractional utilization of VO2max at threshold pace, less efficient running economy, and incomplete glycogen-sparing adaptations. Despite these limitations, the Riegel model remains the most widely used prediction tool due to its simplicity and directional accuracy (Vickers & Vertosick, 2016).
Daniels' VDOT Race Equivalency Tables. Jack Daniels developed an alternative prediction system based on VDOT, a performance index representing the runner's current fitness level. Each VDOT value corresponds to equivalent race times across distances from 1500m to the marathon, calibrated from empirical data of competitive runners. While VDOT tables are not strictly mathematical (they incorporate coaching judgment and population data), they provide an independent cross-check against power-law predictions. Daniels' tables tend to predict more conservative marathon times than Riegel's formula for the same shorter-distance input (Daniels, 2014).
Distance-Specific Fatigue Exponents. Research has shown that the fatigue exponent b is not constant across all distance pairs. Shorter distances (800m-5K) tend to follow exponents closer to 1.03-1.05, while middle-to-long transitions (10K-marathon) may reach 1.07-1.10, particularly for non-elite runners (Karp, 2007). Some prediction models use piecewise exponents or non-linear fits to improve accuracy, though at the cost of increased complexity.
Environmental and Physiological Moderators. Heat stress significantly affects race performance, particularly at longer distances. Ely et al. (2007) analyzed 6 major marathons and found that finish times increased by approximately 1.7% for every 5°C increase in wet-bulb globe temperature above 5°C. Similarly, altitude affects performance through reduced oxygen availability - each 1000m of elevation gain at race start reduces performance by approximately 2-3% (Péronnet & Thibault, 1989). These factors are not captured in basic power-law models.
Limitations
-
The model assumes race-distance-specific training. Predicting marathon time from a 5K requires that the athlete has built the aerobic endurance base necessary for marathon pace. Without 16+ week marathon preparation, predictions will be optimistic by 5-15%.
-
Environmental and course differences are not modeled. A flat, cool 10K versus a hilly, hot marathon represent vastly different physiological challenges. The calculator assumes equivalent conditions across all distances.
-
Pacing strategy affects the results. Riegel's model assumes even pacing. Positive-split races (slowing in the second half) or negative-split races (speeding up) will produce different fatigue curves than the model predicts.
-
Individual physiology varies from population averages. Some runners are "fast-twitch dominant" and perform better at shorter distances relative to their marathon potential (b > 1.06). Others are "slow-twitch dominant" endurance specialists (b < 1.06). The calculator uses a fixed exponent.
-
Sub-elite runners experience greater marathon degradation. The 1.06 exponent was derived from world records. For recreational runners, b ≈ 1.08-1.10 may be more accurate for marathon predictions, meaning the calculator may be optimistic.
-
Recent race performance may not reflect current fitness. If the input race was run months ago, or under non-optimal conditions, predictions will not reflect current capabilities. Use recent, well-executed race efforts for best accuracy.
-
The model does not account for age, sex, or training history. Two runners with identical 10K times may have vastly different marathon potentials depending on training volume, long-run progression, and aerobic base.
ℹ️ IMPORTANT DISCLAIMER
This calculator is for educational purposes only and does NOT constitute medical advice. Consult qualified professionals before making changes. Individual physiology varies. You assume all risk. Must be 18+.
References
Riegel, P. S. (1981). Athletic records and human endurance. American Scientist, 69(3), 285-290.
Vickers, A. J., & Vertosick, E. A. (2016). An empirical study of race times in recreational endurance runners. BMC Sports Science, Medicine and Rehabilitation, 8(1), 26. https://doi.org/10.1186/s13102-016-0052-y
Daniels, J. (2014). Daniels' Running Formula (3rd ed.). Human Kinetics.
Karp, J. R. (2007). Training characteristics of qualifiers for the U.S. Olympic Marathon Trials. International Journal of Sports Physiology and Performance, 2(1), 72-92. https://doi.org/10.1123/ijspp.2.1.72
Ely, M. R., Cheuvront, S. N., Roberts, W. O., & Montain, S. J. (2007). Impact of weather on marathon-running performance. Medicine & Science in Sports & Exercise, 39(3), 487-493. https://doi.org/10.1249/mss.0b013e31802d3aba
Péronnet, F., & Thibault, G. (1989). Mathematical analysis of running performance and world running records. Journal of Applied Physiology, 67(1), 453-465. https://doi.org/10.1152/jappl.1989.67.1.453