Running Performance Snapshot
The Science Behind It
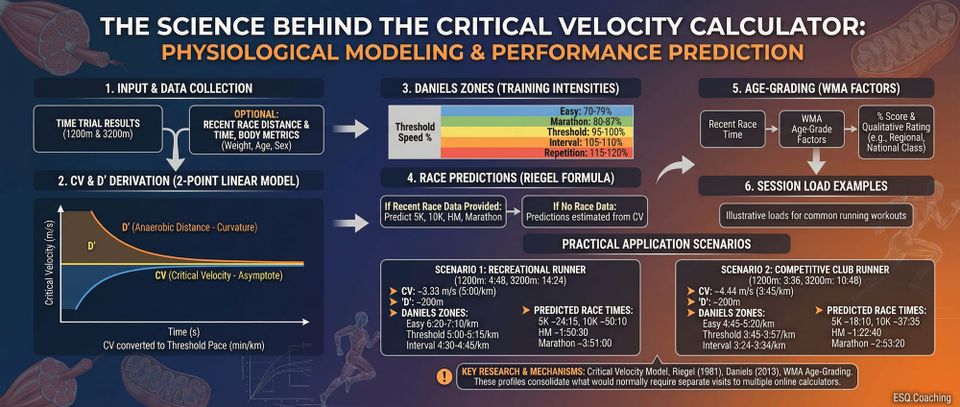
How the Calculator Works
-
Input: Two time-trial results (1200m and 3200m), body weight, age, sex, and an optional recent race distance and time.
-
CV & D' derivation: The two-point linear model extracts Critical Velocity (m/s) and D' (metres). CV is converted to threshold pace (min/km) for practical application.
-
Daniels zones: Threshold pace anchors a 5-zone table:
- Easy: 70-79% of threshold speed
- Marathon: 80-87% of threshold speed
- Threshold: 95-100% of threshold speed
- Interval: 105-110% of threshold speed
- Repetition: 115-120% of threshold speed
-
Race predictions: If a recent race result is provided, Riegel's formula predicts equivalent times for 5K, 10K, half marathon, and marathon. If no race result is available, predictions are estimated from CV.
-
Age-grading: The recent race time is adjusted using WMA age-grade factors, producing a percentage score and qualitative rating (e.g., Regional Class, National Class).
-
Session load examples: Illustrative loads for common running workout types.
Practical Application
Scenario 1: Recreational runner (1200m in 4:48, 3200m in 14:24)
- CV: ~3.33 m/s (5:00/km threshold pace)
- D': ~200m
- Daniels zones: Easy 6:20-7:10/km, Threshold 5:00-5:15/km, Interval 4:30-4:45/km
- Predicted race times: 5K ~24:15, 10K ~50:10, HM ~1:50:30, Marathon ~3:51:00
Scenario 2: Competitive club runner (1200m in 3:36, 3200m in 10:48)
- CV: ~4.44 m/s (3:45/km threshold pace)
- D': ~200m
- Daniels zones: Easy 4:45-5:20/km, Threshold 3:45-3:57/km, Interval 3:24-3:34/km
- Predicted race times: 5K ~18:10, 10K ~37:35, HM ~1:22:40, Marathon ~2:53:20
These profiles consolidate what would normally require separate visits to multiple online calculators.
Why This Matters
Runners routinely use separate tools to estimate threshold pace, predict race times, check age-graded performance, and determine training zones. The Running Performance Snapshot combines all of these into a single assessment. Two time-trial efforts (1200m and 3200m) plus an optional recent race result generate a complete physiological profile: Critical Velocity, D' (anaerobic distance reserve), Daniels training zones, race predictions from 5K to marathon, and age-graded performance percentage.
The Research
Critical Velocity (CV) and D' (2-point linear model). CV is the running analogue of Critical Power, representing the highest speed that can be sustained in a metabolic steady state. The concept was formalized by Hill (1927) and applied to running by Hughson et al. (1984). The two-point linear model (CV = (d1 - d2) / (t1 - t2)) extracts CV from two maximal-effort time trials at different distances. D' (D-prime) represents the finite distance that can be covered above CV before exhaustion, analogous to W' in cycling. Test distances of 1200m and 3200m provide appropriate separation on the speed-duration curve.
Daniels Training Zones. Jack Daniels' 5-zone model (Easy, Marathon, Threshold, Interval, Repetition) is one of the most widely used frameworks in distance running (Daniels, 2014). Zones are anchored to VDOT - Daniels' fitness index derived from race performance. The Snapshot uses threshold pace (derived from CV) as the anchor, which closely approximates Daniels' Threshold pace zone. The remaining zones are scaled using Daniels' published percentage relationships.
Riegel Race Prediction Model. Peter Riegel's power-law model (T₂ = T₁ × (D₂/D₁)1.06) has been the standard for race time prediction since 1981. The fatigue exponent of 1.06 was derived from world-record analysis across distances. While it tends to be optimistic for longer distances in sub-elite runners (Vickers & Vertosick, 2016), it provides useful directional guidance.
Age-Grading (WMA Tables). The World Masters Athletics age-grading system applies age- and sex-specific correction factors to running times, enabling comparison across demographics. The factors are derived from world-record progressions and updated periodically. Age-grading percentage is calculated as (reference_time / actual_time) × 100, where a higher percentage indicates better performance relative to age/sex peers.
Limitations
-
The 2-point CV model assumes linearity. With only two data points, the model cannot detect curvature in the speed-distance relationship. Three or more trials at different distances would improve accuracy. The linear model may overestimate CV by 2-5% compared to the hyperbolic model.
-
Both time trials must be genuinely maximal. If either effort is submaximal (e.g., due to poor pacing, fatigue, or conditions), the CV estimate will be inaccurate. The calculator cannot detect submaximal efforts.
-
Riegel predictions are optimistic for longer distances. The fatigue exponent of 1.06 was derived from world-class performances. Sub-elite runners typically fatigue more, meaning marathon predictions may be 3-8% faster than achievable without specific marathon training.
-
Daniels zones are population-based guidelines. Individual ventilatory and lactate thresholds may differ from the percentage-based zone boundaries. Laboratory testing provides individually calibrated thresholds.
-
Age-grading assumes current world-record progression patterns. The WMA factors may not perfectly represent the aging curve for all populations, particularly at very young or very old ages. The polynomial approximation used to interpolate age-grade factors diverges above age 55; values for athletes over 60 should be treated as estimates with ±5-10% uncertainty.
-
Environmental conditions are not modeled. Heat, altitude, wind, and terrain all affect running performance. The calculator assumes standard conditions.
ℹ️ IMPORTANT DISCLAIMER
This calculator is for educational purposes only and does NOT constitute medical advice. Consult qualified professionals before making changes. Individual physiology varies. You assume all risk. Must be 18+.
References
Hill, A. V. (1927). Muscular movement in man: the factors governing speed and recovery from fatigue. McGraw-Hill.
Hughson, R. L., Orok, C. J., & Staudt, L. E. (1984). A high velocity treadmill running test to assess endurance running potential. International Journal of Sports Medicine, 5(1), 23-25. https://doi.org/10.1055/s-2008-1025875
Daniels, J. (2014). Daniels' Running Formula (3rd ed.). Human Kinetics.
Riegel, P. S. (1981). Athletic records and human endurance. American Scientist, 69(3), 285-290.
Vickers, A. J., & Vertosick, E. A. (2016). An empirical study of race times in recreational endurance runners. BMC Sports Science, Medicine and Rehabilitation, 8(1), 26. https://doi.org/10.1186/s13102-016-0052-y
World Masters Athletics. (2023). Age-grading calculator and tables. https://world-masters-athletics.com/