Triathlon Performance Snapshot
The Science Behind It
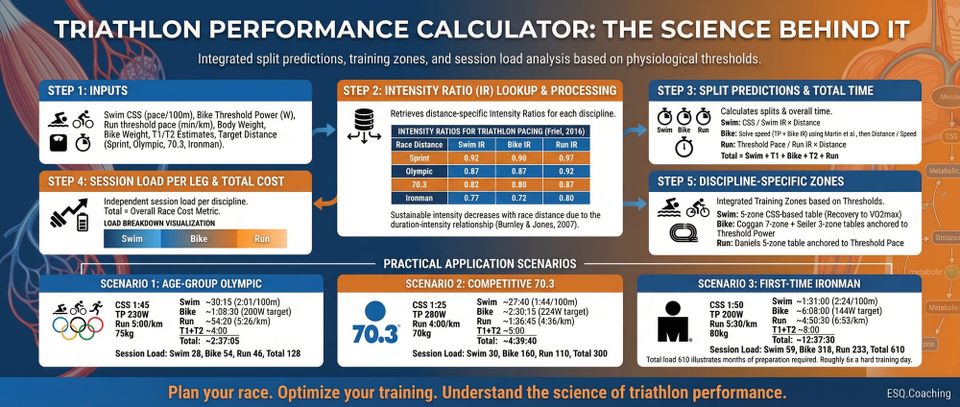
How the Calculator Works
This snapshot incorporates the former standalone Triathlon Race Split Calculator. Race split predictions are available to all members; advanced analytics (session load breakdown, training zones, pacing targets) require a paid membership.
-
Input: Swim CSS (pace/100m), bike Threshold Power (W), run threshold pace (min/km), body weight, bike weight, T1 and T2 estimates, and target race distance (Sprint/Olympic/70.3/Ironman).
-
IR lookup: The calculator retrieves distance-specific intensity ratios for each discipline.
-
Split predictions:
- Swim: CSS pace / swim IR * swim distance
- Bike: Solve speed from (TP * bike IR) using Martin et al., then distance / speed
- Run: Threshold pace / run IR * run distance
- Total = Swim + T1 + Bike + T2 + Run
-
Session load per leg: Each discipline's duration and IR produce an independent session load value. The total gives an overall race cost metric.
-
Discipline zones:
- Swim: 5-zone CSS-based table (Recovery through VO2max)
- Bike: Coggan 7-zone + Seiler 3-zone tables anchored to Threshold Power
- Run: Daniels 5-zone table anchored to threshold pace
-
Load breakdown visualization: A stacked bar shows the relative session load contribution of each discipline.
Practical Application
Scenario 1: Age-group Olympic triathlon (CSS 1:45/100m, TP 230W, run threshold 5:00/km, 75 kg)
- Swim (1.5 km): ~30:15 at 2:01/100m
- Bike (40 km): ~1:08:30 at 200W target
- Run (10 km): ~54:20 at 5:26/km
- T1 + T2: ~4:00
- Total: ~2:37:05
- Session load: Swim 28, Bike 54, Run 46, Total 128
Scenario 2: Competitive 70.3 (CSS 1:25/100m, TP 280W, run threshold 4:00/km, 70 kg)
- Swim (1.9 km): ~27:40 at 1:44/100m
- Bike (90 km): ~2:30:15 at 224W target
- Run (21.1 km): ~1:36:45 at 4:36/km
- T1 + T2: ~5:00
- Total: ~4:39:40
- Session load: Swim 30, Bike 160, Run 110, Total 300
Scenario 3: First-time Ironman (CSS 1:50/100m, TP 200W, run threshold 5:30/km, 80 kg)
- Swim (3.8 km): ~1:31:00 at 2:24/100m
- Bike (180 km): ~6:08:00 at 144W target
- Run (42.2 km): ~4:50:30 at 6:53/km
- T1 + T2: ~8:00
- Total: ~12:37:30
- Session load: Swim 59, Bike 318, Run 233, Total 610
The total session load of 610 for an Ironman illustrates why this race demands months of preparation. It represents roughly six times the load of a hard training day.
Why This Matters
Triathlon race planning is uniquely complex. Athletes must distribute effort across three disciplines, two transitions, and durations ranging from one hour (sprint) to seventeen hours (Ironman). Each discipline has its own threshold, its own zone system, and its own pacing requirements. Cumulative fatigue from each leg directly impacts the next. The Triathlon Performance Snapshot consolidates all of this into a single assessment: enter your swim, bike, and run thresholds, select a race distance, and receive predicted split times, combined training zones for all three disciplines, session load per leg, and a realistic total finish time.
The Research
The snapshot integrates validated models from five distinct areas:
Intensity Ratios for Triathlon Pacing. The IR concept, adapted from Joe Friel's Triathlete's Training Bible (Friel, 2016), expresses race effort as a fraction of discipline-specific threshold. The key insight: sustainable intensity decreases with race distance due to the duration-intensity relationship (Burnley & Jones, 2007). The calculator uses distance-specific IR tables:
| Race Distance | Swim IR | Bike IR | Run IR |
|---|---|---|---|
| Sprint | 0.92 | 0.90 | 0.97 |
| Olympic | 0.87 | 0.87 | 0.92 |
| 70.3 | 0.82 | 0.80 | 0.87 |
| Ironman | 0.77 | 0.72 | 0.80 |
Bike IR values align with Friel's published recommendations (0.70-0.76 for Ironman, 0.75-0.85 for 70.3). Run IR values account for prior swim and bike fatigue.
Critical Swim Speed (CSS). CSS from the 200m/400m test (Wakayoshi et al., 1993) anchors swim pacing. The swim split is calculated as the swim distance divided by (CSS * swim IR).
Power-to-Speed Model (Martin et al., 1998). The bike split uses the Martin et al. force balance equation to convert threshold power (scaled by bike IR) into average speed, then derives the time for the bike distance. This accounts for rider mass, bike mass, aerodynamic drag, and rolling resistance.
Daniels Running Zones. The run split uses threshold pace (scaled by run IR) for time prediction, and the Daniels 5-zone model for training zone prescription (Daniels, 2014).
Session Load Model. Session load (hours × IR² × 100) provides a training-load estimate for each discipline leg, enabling athletes to understand the relative physiological cost of each portion of the race. This also facilitates training planning: knowing that the Ironman bike represents ~70% of total session load helps prioritize brick workout design.
Limitations
-
IR values are coaching heuristics, not empirically derived constants. While grounded in decades of coaching experience, the specific IR targets have not been validated in controlled laboratory studies. They represent practical guidelines for sustainable pacing.
-
Cumulative fatigue is not mechanistically modeled. The calculator uses static IR values per discipline rather than modeling how swim and bike fatigue progressively degrade run performance. In practice, run pace degradation in triathlon is well-documented and often exceeds what a single IR value suggests (Wu et al., 2021).
-
The bike split assumes flat, windless conditions. Real courses with climbing, descending, and wind require more sophisticated pacing (e.g., variable power strategy) that a single IR value cannot capture.
-
Transition times are user-estimated. T1 and T2 times vary enormously based on transition layout, equipment choices, and athlete experience. The default values (2-3 minutes) reflect competent age-group transitions.
-
The swim split does not account for open-water factors. Unlike the Swimming Snapshot, the triathlon calculator uses pure CSS-based prediction without wetsuit, navigation, or drafting adjustments. Athletes should consult the Swimming Snapshot for condition-adjusted estimates.
-
Session load is a simplified metric. The IR² × hours × 100 formula provides directional guidance but does not capture the full complexity of training load, which depends on individual fitness, glycogen status, and environmental conditions.
-
Individual discipline thresholds are assumed to be independently measured. In practice, these thresholds interact - an athlete's run threshold may be lower after a hard bike ride. The calculator uses standalone thresholds, not fatigued-state thresholds.
-
Age-grade polynomial approximation. If age-graded performance comparisons are drawn from this snapshot, note that the polynomial approximation used to interpolate WMA age-grade factors diverges above age 55; values for athletes over 60 should be treated as estimates with ±5-10% uncertainty.
ℹ️ IMPORTANT DISCLAIMER
This calculator is for educational purposes only and does NOT constitute medical advice. Consult qualified professionals before making changes. Individual physiology varies. You assume all risk. Must be 18+.
References
Friel, J. (2016). The Triathlete's Training Bible (4th ed.). VeloPress.
Burnley, M., & Jones, A. M. (2007). Oxygen uptake kinetics as a determinant of sports performance. European Journal of Sport Science, 7(2), 63-79. https://doi.org/10.1080/17461390701456148
Wakayoshi, K., Ikuta, K., Yoshida, T., et al. (1993). Determination and validity of critical velocity as an index of swimming performance. European Journal of Applied Physiology, 64(2), 153-157. https://doi.org/10.1007/BF00717953
Martin, J. C., Milliken, D. L., Cobb, J. E., McFadden, K. L., & Coggan, A. R. (1998). Validation of a mathematical model for road cycling power. Journal of Applied Biomechanics, 14(3), 276-291. https://doi.org/10.1123/jab.14.3.276
Daniels, J. (2014). Daniels' Running Formula (3rd ed.). Human Kinetics.
Wu, S. S. X., Peiffer, J. J., Brisswalter, J., Nosaka, K., & Abbiss, C. R. (2021). Running your best triathlon race. International Journal of Sports Physiology and Performance, 16(5), 744-748. https://doi.org/10.1123/ijspp.2020-0698
Abbiss, C. R., & Laursen, P. B. (2008). Describing and understanding pacing strategies during athletic competition. Sports Medicine, 38(3), 239-252. https://doi.org/10.2165/00007256-200838030-00004