Training Stress Score Calculator
📋 What is TSS?
TSS puts a single number on how hard a workout was.
TSS 100 = one hour at your threshold| TSS | Example Session |
|---|---|
| 20–40 | Easy 1-hour recovery ride |
| 50–80 | 1-hour endurance ride |
| 100 | 1 hour at FTP (by definition) |
| 120–150 | Hard 90-min interval session |
| 200–300 | 3–4 hour hard group ride |
| 300–450 | Century ride or hard stage race |
| 450+ | Ironman bike leg, epic day |
🎯 STEP-BY-STEP GUIDE
Power-Based TSS (Most Accurate)
Enter:
- Duration (minutes)
- Normalized Power (from your cycling computer)
- FTP (Functional Threshold Power)
Heart Rate TSS
Enter:
- Duration (minutes)
- Average HR (bpm)
- LTHR (Lactate Threshold HR)
- Resting HR and Max HR (optional, improves accuracy)
Pace-Based TSS (Running/Swimming)
Enter:
- Duration (minutes)
- Average Pace (min/km or min/100m)
- Threshold Pace
If you want to see what I read to keep my own work sharp outside this newsletter, this is the list.

🔬 THE TSS FORMULA
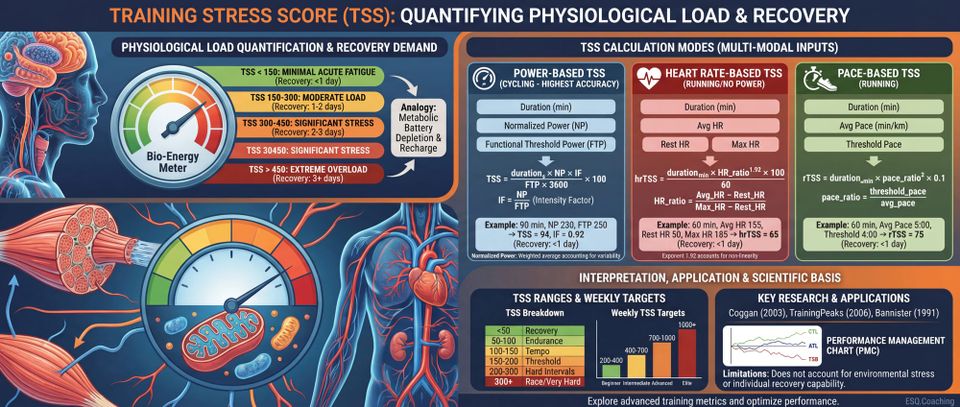
TSS = (Duration_sec × NP × IF) / (FTP × 3600) × 100

Where IF = NP / FTP
Worked Example
90 min ride, NP = 230W, FTP = 250W

IF = 230 / 250 = 0.92
TSS = (5400 × 230 × 0.92) / (250 × 3600) × 100
    = 1,143,360 / 900,000 × 100
    = 127
📊 RECOVERY INTERPRETATION
| TSS | Stress | Recovery Outlook |
|---|---|---|
| < 150 | Low | Most trained athletes resume quality next day |
| 150–300 | Moderate | 24–48 h before high-intensity, depends on CTL and IF |
| 300–450 | High | 36–72 h. Glycogen status is the limiting variable |
| > 450 | Very high | Event-level. 48–96 h, governed by fuelling and sleep |
⚠️ Important Caveats
Two sessions with the same TSS can produce very different fatigue:
- 5 hours at IF 0.78 → ~300 TSS (mostly aerobic, moderate glycogen cost)
- 2.5 hours at IF 0.98 → ~300 TSS (high neuromuscular strain, massive glycogen depletion)
Recovery also depends on:
- CTL (Chronic Training Load): CTL 110 athlete absorbs 300 TSS in 24–36 h. CTL 50 athlete needs 48–72 h.
- Carb intake: Glycogen restoration = ~24 h at 6–10 g/kg/day. Insufficient fuelling = 48+ h.
- Intensity distribution: Supra-threshold work creates more central fatigue
- Sleep, heat, age, cumulative fatigue: All modify recovery
Interpreting Your Score:
TSS Breakdown:
<50:   Recovery/Easy
50-100: Endurance
100-150: Tempo/Sweet spot
150-200: Threshold work
200-300: Hard intervals
300+: Race or very hard session
Weekly TSS Targets:
- Beginner: 200-400 per week
- Intermediate: 400-700 per week
- Advanced: 700-1000 per week
- Elite: 1000+ per week
🔬 Scientific Basis
Key Research:
- Coggan (2003) - "Training and Racing with a Power Meter"
- TrainingPeaks (2006) - "Performance Management Chart"
- Bannister (1991) - "Modeling elite athletic performance"
The Power-Based Formula:
TSS = (duration_seconds × NP × IF) / (FTP × 3600) × 100

Where:
IF (Intensity Factor) = NP / FTP
Why This Works:
- Duration matters: 2 hours at FTP = 200 TSS (by definition)
- Intensity matters: Harder efforts = exponentially more stress
- IF squared: Captures non-linear fatigue
Example Math:
90 min at NP 230W, FTP 250W:

IF = 230 / 250 = 0.92
TSS = (5400 sec × 230W × 0.92) / (250W × 3600) × 100
    = 1,143,720 / 900,000 × 100
    = 94 TSS
Heart Rate-Based Formula:
hrTSS = duration_minutes × HR_ratio^1.92 × 100 / 60

Where:
HR_ratio = (Avg_HR - Rest_HR) / (Max_HR - Rest_HR)
Why the 1.92 exponent?
- Empirically derived to match power-based TSS
- Accounts for cardiac drift and non-linearity
Pace-Based Formula:
rTSS = duration_minutes × pace_ratio^2 × 0.1

Where:
pace_ratio = threshold_pace / avg_pace
Applications:
- Performance Management Chart (PMC):
- CTL (Chronic Training Load): 42-day rolling average (fitness)
- ATL (Acute Training Load): 7-day rolling average (fatigue)
- TSB (Training Stress Balance): CTL - ATL (form)
- Periodization:
- Build phase: Increase weekly TSS gradually
- Peak phase: Maintain TSS with higher intensity
- Taper: Reduce TSS 40-60%
Limitations:
- Doesn't account for terrain (climbing)
- Doesn't capture heat stress
- Individual recovery varies
- Best used as relative metric
Disclaimer
The information provided in this newsletter is for educational purposes only and does not constitute medical advice. Exercise physiology is highly individual; what works for elite populations may not apply to everyone. Always consult with a physician before making significant changes to your training, nutrition, or supplementation protocols. The Scientist's Notebook and ESQ Coaching accept no liability for injuries or health issues arising from the application of these concepts.