Climbing Speed & VAM Calculator
The Science Behind It
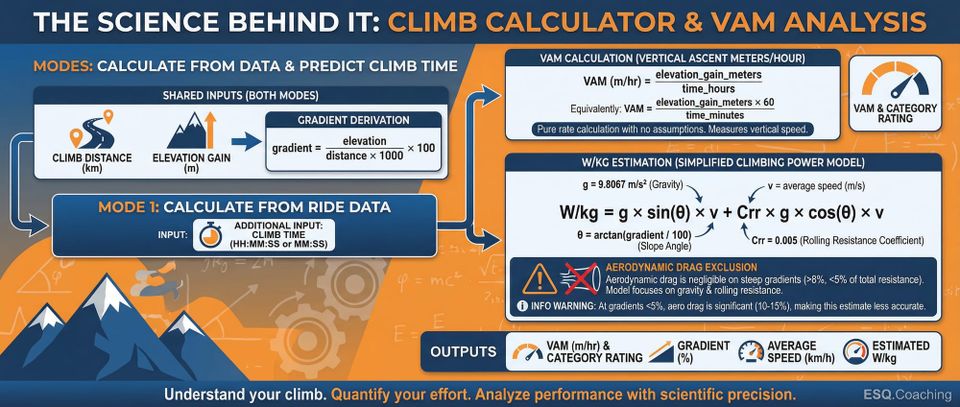
How the Calculator Works
The calculator has two modes: calculate from ride data, and predict climb time.
Shared inputs (both modes)
- Climb distance (km)
- Elevation gain (m)
Average gradient is derived automatically: gradient = (elevation / (distance × 1000)) × 100
Mode 1: Calculate from ride data
Additional input: Climb time (HH:MM:SS or MM:SS format)
VAM formula:
VAM (m/hr) = elevation_gain_meters / time_hours
Equivalently: VAM = (elevation_gain_meters × 60) / time_minutes
This is a pure rate calculation with no assumptions.
W/kg estimation:
The calculator uses a simplified climbing power model - gravity plus rolling resistance, with aerodynamic drag excluded:
W/kg = g × sin(θ) × v + Crr × g × cos(θ) × v
Where:
- θ = arctan(gradient / 100)
- v = average climbing speed in m/s (distance / time)
- g = 9.8067 m/s²
- Crr = 0.005 (fixed rolling resistance coefficient)
Aerodynamic drag is excluded because it is negligible on steep gradients (above ~8%, aero contributes under 5% of total resistance). At 5% gradient, aero drag can account for 10-15% of resistance - the calculator surfaces an info warning when gradient falls below 5% to flag this limitation.
Outputs:
- VAM (m/hr) and category rating
- Gradient (%)
- Average speed (km/h)
- Estimated W/kg
Mode 2: Predict climb time
Additional inputs:
- Sustainable W/kg (1-8)
- Rider + Bike weight (kg, 50-150)
The same simplified model is inverted to solve for speed:
speed (m/s) = W/kg / (g × (sin(θ) + Crr × cos(θ)))
Then: time = distance / speed
And: VAM = elevation_gain / time_in_hours
Outputs:
- Predicted climb time
- VAM (m/hr) and category rating
- Gradient (%)
- Predicted speed (km/h)
VAM Categories
The calculator applies these thresholds:
| Category | VAM (m/hr) |
|---|---|
| Elite Pro | >1800 |
| Pro | 1500-1800 |
| Cat 1 | 1200-1500 |
| Cat 2 | 1000-1200 |
| Cat 3 | 800-1000 |
| Recreational | <800 |
Practical Application
Example 1: Analyzing a training climb
A cyclist climbs 450m in 35 minutes over 6.4 km.
VAM = 450 / (35/60) = 450 / 0.583 = 771 m/hr  -> Recreational
gradient = (450 / 6400) * 100 = 7.0%
theta = arctan(0.070) = 3.99 degrees
v = 6.4 / 0.583 = 10.98 km/h = 3.05 m/s

W/kg = 9.8067 * sin(3.99 deg) * 3.05 + 0.005 * 9.8067 * cos(3.99 deg) * 3.05
     = 9.8067 * 0.0696 * 3.05 + 0.005 * 9.8067 * 0.9976 * 3.05
     = 2.082 + 0.149
     = 2.23 W/kg
To reach Cat 3 territory (VAM >800), the rider would need to complete the same climb in under 33:45.
Example 2: Predicting a race climb
A rider sustains 4.0 W/kg. Target climb: 1071m elevation gain, 13.8 km (Alpe d'Huez-scale).
gradient = (1071 / 13800) * 100 = 7.76%
theta = arctan(0.0776) = 4.44 degrees

speed = 4.0 / (9.8067 * (sin(4.44 deg) + 0.005 * cos(4.44 deg)))
      = 4.0 / (9.8067 * (0.07742 + 0.004987))
      = 4.0 / (9.8067 * 0.08241)
      = 4.0 / 0.8083
      = 4.95 m/s = 17.82 km/h

time = 13.8 / 17.82 = 0.775 hours = 46:30
VAM = 1071 / 0.775 = 1382 m/hr  -> Cat 1
Example 3: Comparing two climbs
Rider A: Mont Ventoux from Bedoin, 1610m gain in 1:45:00.
Rider B: Stelvio from Prato, 1808m gain in 2:05:00.
Rider A VAM = 1610 / 1.75 = 920 m/hr  -> Cat 3
Rider B VAM = 1808 / 2.083 = 868 m/hr  -> Cat 3
Rider A produced higher VAM. VAM normalizes for distance and elevation, making it a fair cross-climb comparison. Note that the Stelvio tops out at 2758m vs Ventoux at 1912m - the physiological cost of altitude is real but not captured by this model.
Why This Matters
On a steep gradient, aerodynamics recede and the dominant equation becomes power versus gravity. That is why watts per kilogram defines climbing performance.
VAM - Velocita Ascensionale Media, or average ascent speed in meters per hour - was developed by Italian sports physician Dr. Michele Ferrari as a practical way to compare climbing performances across different mountains without a power meter. You need only elevation gained and time elapsed.
For coaches and athletes without power meters, VAM provides a meaningful performance metric from basic GPS data. For those with power meters, it offers a cross-climb comparison that absolute power cannot.
The Research
Physics of cycling uphill
The foundational cycling power model was established by Martin, Milliken, Cobb, McFadden, and Coggan (1998), who validated a mathematical model predicting cycling power from measurable variables (R-squared = 0.97, standard error 2.7 watts). Their model decomposes total power into resistance components:
Ptotal = Pgravity + Prolling + Paero + Pdrivetrain
Expanded:
P = m × g × sin(θ) × v + Crr × m × g × cos(θ) × v + 0.5 × ρ × CdA × v³ + Pdrivetrain loss
Where:
- m = total mass (rider + bike + gear), kg
- g = gravitational acceleration, 9.81 m/s²
- θ = road angle (arctan of gradient)
- v = velocity, m/s
- Crr = rolling resistance coefficient (typically 0.004-0.008)
- ρ = air density (1.225 kg/m³ at sea level)
- CdA = aerodynamic drag area (typically 0.30-0.45 m² for road cycling)
On steep climbs (above 7%), gravity dominates. At 10% gradient and 15 km/h, gravity accounts for roughly 85-90% of total resistance, rolling resistance 5-8%, and aerodynamics 3-7%. This is why the calculator's simplified model (gravity + rolling resistance only) is a reasonable approximation for steep climbs - but becomes less accurate below 5-6%.
The W/kg estimation model used here
Calculate mode estimates W/kg from ride data using gravity + rolling resistance:
W/kg ≈ g × sin(θ) × v + Crr × g × cos(θ) × v
This simplified model excludes aerodynamic drag, which is negligible above ~8% gradient but accounts for 10-15% of resistance at 5%.
Predict mode uses the full power balance equation including aerodynamic drag, solved with Newton's method:
P = 0.5 × CdA × ρ × v³ + Crr × m × g × cos(θ) × v + m × g × sin(θ) × v
Using CdA = 0.4 (hoods/climbing position), ρ = 1.225 kg/m³. This prevents unrealistic speed predictions at shallow gradients where aerodynamic drag dominates.
This is not the Ferrari VAM formula. Ferrari's published approximation uses a gradient factor (2 + percent_grade/10) to convert VAM directly to W/kg. This calculator does not use that formula. Instead it applies the physics model directly to the measured speed.
VAM categories - context
Professional race data and coaching benchmarks produce these approximate W/kg ranges on a typical 8% climb:
| Category | VAM (m/hr) | Approximate W/kg (8% gradient) |
|---|---|---|
| World Tour GC contender | 1700-1900 | 6.1-6.8 |
| World Tour domestique | 1500-1700 | 5.4-6.1 |
| Professional continental | 1350-1500 | 4.8-5.4 |
| Elite amateur / Cat 1 | 1200-1400 | 4.3-5.0 |
| Strong club cyclist | 1000-1200 | 3.6-4.3 |
| Recreational cyclist | 600-1000 | 2.1-3.6 |
| Untrained rider | <600 | <2.1 |
The W/kg ranges above use the full physics model for reference. The calculator's simplified model will give slightly lower W/kg estimates because it excludes the aero term.
Historical note: In the EPO era (mid-1990s to early 2000s), Tour de France mountain stages regularly produced VAM values exceeding 1800-1900 m/hr on major climbs. Post-biological passport values have generally decreased to 1650-1800 m/hr for stage-winning performances.
Limitations
-
Aero drag excluded: The W/kg estimate omits aerodynamic drag. At gradients above 8% this is a reasonable simplification. Below 5%, the error is 10-15% or more. In predict mode, gradients below 3% trigger a recommendation to use the Power-to-Speed calculator instead (which includes the full aerodynamic model), while gradients between 3-5% include the aerodynamic model but note that results are more reliable above 5%.
-
Variable gradients: VAM averages over the entire climb. A climb with a 10% ramp, a 2% false flat, and another 10% ramp will produce a misleadingly low VAM compared to a consistent 7% climb at the same average gradient, because the rider travels faster on the flat sections, contributing less vertical gain per unit time.
-
Altitude not modeled: Reduced air density at altitude slightly affects the physics, but the physiological cost of altitude is significant and not captured by any power estimate.
-
Wind: Headwinds and tailwinds are not accounted for but can shift power requirements by 10-20% on exposed climbs.
-
Drafting: In group riding, drafting reduces aerodynamic drag, allowing faster climbing at the same power. The effect is smaller than on flat terrain but measurable.
-
Crr assumed constant: The calculator fixes Crr at 0.005. Road surface, tire pressure, and tire choice can shift this between 0.003 and 0.010, affecting W/kg estimates by up to 5%.
ℹ️ IMPORTANT DISCLAIMER
This calculator is for educational purposes only and does NOT constitute medical advice. Consult qualified professionals before making changes. Individual physiology varies. You assume all risk. Must be 18+.
References
Ferrari, M. (2003). Velocita Ascensionale Media and cycling performance. Published on personal website (archived).
Martin, J. C., Milliken, D. L., Cobb, J. E., McFadden, K. L., & Coggan, A. R. (1998). Validation of a mathematical model for road cycling power. Journal of Applied Biomechanics, 14(3), 276-291.
Mognoni, P., & di Prampero, P. E. (2003). Gear, inertia, and rolling resistance in road cycling. European Journal of Applied Physiology, 89(1), 47-51.
Padilla, S., Mujika, I., Cuesta, G., & Goiriena, J. J. (1999). Level ground and uphill cycling ability in professional road cycling. Medicine and Science in Sports and Exercise, 31(6), 878-885.
Olds, T. S. (2001). Modelling human locomotion: Applications to cycling. Sports Medicine, 31(7), 497-509.
di Prampero, P. E., Cortili, G., Mognoni, P., & Saibene, F. (1979). Equation of motion of a cyclist. Journal of Applied Physiology, 47(1), 201-206.
Cycling Power Lab. (2023). VAM and relative power. Retrieved from http://www.cyclingpowerlab.com/VAM.aspx
VeloViewer. (2023). VAM and relative power - what's that all about then? Retrieved from https://blog.veloviewer.com/vam-and-relative-power-whats-that-all-about-then/