VLaMax (Glycolytic Power)
The Science Behind It
How the Calculator Works
Inputs
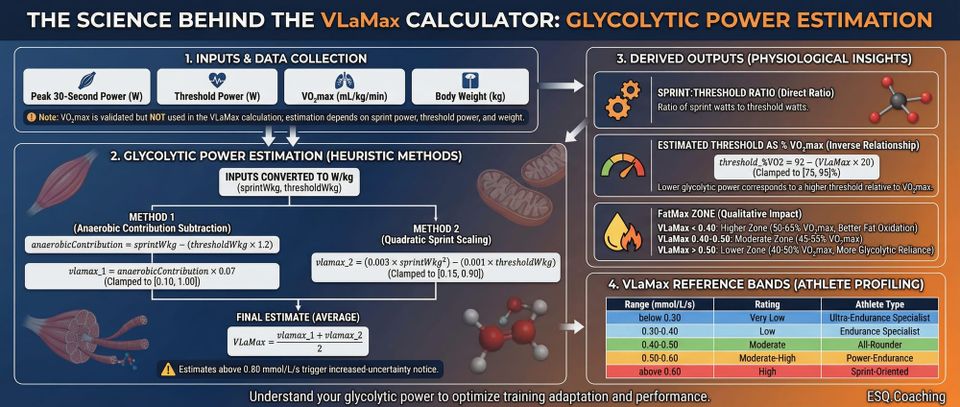
The calculator collects four fields:
- Peak 30-Second Power (W) - maximum average power over a 30-second all-out effort
- Threshold Power (W) - your threshold power or critical power
- VO2max (mL/kg/min) - required to pass validation, but not used in the VLaMax calculation (see note below)
- Body Weight (kg) - used to convert power values to W/kg
Note: VO2max is collected and validated but does not enter the glycolytic power estimation formulas. The estimate depends entirely on sprint power, threshold power, and body weight.
Glycolytic Power Estimation
The calculator uses two independent heuristic methods and averages them.
Method 1 - Anaerobic contribution subtraction:
First, sprint power and threshold power are converted to W/kg:
sprintWkg = sprintPower / weight
thresholdWkg = thresholdPower / weight
The anaerobic contribution is estimated by subtracting an aerobically-driven threshold component:
anaerobicContribution = sprintWkg - (thresholdWkg × 1.2)
VLaMax estimate from method 1:
vlamax_1 = anaerobicContribution × 0.07
Result is clamped to the range [0.10, 1.00] mmol/L/s.
Method 2 - Quadratic sprint scaling:
vlamax_2 = (0.003 × sprintWkg²) - (0.001 × thresholdWkg)
Result is clamped to the range [0.15, 0.90] mmol/L/s.
Final estimate:
VLaMax = (vlamax_1 + vlamax_2) / 2
Estimates above 0.80 mmol/L/s trigger an increased-uncertainty notice.
Derived Outputs
Sprint:Threshold ratio - direct ratio of sprint watts to threshold watts.
Estimated threshold as % VO2max - derived from the VLaMax estimate, not from the VO2max input:
threshold_%VO2 = 92 - (VLaMax × 20), clamped to [75, 95]%
This reflects the inverse relationship: lower glycolytic power corresponds to a higher threshold relative to VO2max.
FatMax zone - a qualitative impact assessment based on VLaMax bands:
- VLaMax below 0.40: higher FatMax zone (50-65% VO2max), better fat oxidation
- VLaMax 0.40-0.50: moderate FatMax zone (45-55% VO2max)
- VLaMax above 0.50: lower FatMax zone (40-50% VO2max), more glycolytic reliance
VLaMax reference bands:
| Range (mmol/L/s) | Rating | Athlete Type |
|---|---|---|
| below 0.30 | Very Low | Ultra-Endurance Specialist |
| 0.30-0.40 | Low | Endurance Specialist |
| 0.40-0.50 | Moderate | All-Rounder |
| 0.50-0.60 | Moderate-High | Power-Endurance |
| above 0.60 | High | Sprint-Oriented |
What These Formulas Do Not Capture
Both estimation methods are heuristics. Neither uses blood lactate, gas exchange data, or multiple test durations. The sprint:threshold power ratio captures the direction of glycolytic capacity - a higher ratio suggests higher VLaMax - but the magnitude depends on confounding factors the formulas cannot separate:
- Neuromuscular factors (muscle fiber type, recruitment, pedaling mechanics) drive sprint power independently of glycolytic capacity
- Threshold power reflects lactate clearance capacity, economy, and training status in addition to VLaMax
- Individual variation in the sprint-to-VLaMax relationship is not captured by a fixed scaling coefficient
Treat the output as a directional screening estimate, not a measured value.
The Concept Behind VLaMax
For decades, endurance performance was defined by a single metric: VO2max. VO2max measures your aerobic ceiling. VLaMax quantifies the other side - glycolytic power - the rate at which your muscles can produce energy via anaerobic glycolysis. This matters because VLaMax influences your threshold, your fat oxidation rate, your carbohydrate burn rate, and how long you can sustain a given intensity.
The practical implication is a two-dimensional optimization problem. Two athletes with identical VO2max values can have very different performance profiles depending on VLaMax. The athlete with VO2max of 70 mL/kg/min and VLaMax of 0.3 mmol/L/s will have a higher threshold, better fat oxidation, and superior ultra-endurance capability compared to an athlete with the same VO2max but VLaMax of 0.7 mmol/L/s. The second athlete will be better suited to surges, sprints, and shorter events.
Practical Application
Training periodization for triathletes: A triathlete with a relatively high VLaMax (0.6 mmol/L/s) may find their threshold power is lower than expected for their VO2max. High glycolytic power suppresses threshold by increasing lactate production at moderate intensities. The training response is high-volume, low-intensity work to suppress VLaMax through slow-twitch fiber adaptation, not more interval work that would maintain or raise glycolytic capacity.
Race distance selection: An athlete with low VLaMax and moderate VO2max will excel at ultra-endurance events where high fat oxidation and a high threshold percentage compensate for lower top-end power. An athlete with high VLaMax should target shorter events (5K, 10K, criteriums) where anaerobic contribution is advantageous.
Fueling strategy: An athlete with high VLaMax burns through glycogen faster at any given intensity. They need more aggressive carbohydrate fueling during long events compared to a low-VLaMax athlete at the same pace.
The Research
Mader (1984, 2003) - The Theoretical Foundation
VLaMax originates from the work of Alois Mader, a German exercise physiologist who developed mathematical models of human energy metabolism beginning in the 1970s.
Mader constructed a system of differential equations describing the interplay between aerobic and anaerobic energy production during exercise. The model treats metabolism as a balance between:
- Oxidative phosphorylation (aerobic, parameterized by VO2max)
- Glycolysis (anaerobic, parameterized by VLaMax)
- Phosphocreatine hydrolysis (immediate energy, finite and rapidly exhausted)
In this framework, VLaMax represents the maximum rate at which the glycolytic pathway can produce ATP, expressed through its measurable byproduct: lactate. The unit is mmol/L/s.
Key model insights:
- VLaMax reduces the anaerobic threshold. Higher glycolytic power means more lactate production at any given intensity, pushing the lactate threshold to a lower percentage of VO2max.
- VLaMax reduces fat oxidation. High glycolytic activity suppresses fat oxidation by flooding the mitochondria with pyruvate from glycolysis, leaving less capacity for fatty acid oxidation.
- VLaMax increases carbohydrate burn rate. More glycogen is consumed per unit of time at any intensity above baseline.
- The interaction between VO2max and VLaMax matters more than either value alone.
VLaMax Measurement Protocol
Mader proposed a practical test: the maximal lactate accumulation rate test, measured during an approximately 10-15 second all-out effort. The calculation:
VLaMax = Delta_BLa / (T - t_alac)
where:
- Delta_BLa = change in blood lactate concentration (mmol/L), from pre-sprint to post-sprint peak
- T = sprint duration (seconds)
- t_alac = alactic time - the initial period (approximately 2-3 seconds) during which energy comes from phosphocreatine rather than glycolysis
Typical VLaMax values:
- 0.2-0.3 mmol/L/s: low glycolytic power, slow-twitch profile, ideal for ultra-endurance
- 0.4-0.5 mmol/L/s: moderate, typical trained endurance athlete
- 0.6-0.8 mmol/L/s: high, typical trained sprinter or track cyclist
- 0.8-1.0+ mmol/L/s: very high, elite sprinters and track cyclists
INSCYD: Commercializing Mader's Model
INSCYD (founded by Sebastian Weber, who studied under researchers in the Mader tradition) is a software platform that operationalized Mader's mathematical model for practical coaching use. Their Power-Performance Decoder (PPD) uses field test data to estimate VO2max and VLaMax without requiring a metabolic cart.
INSCYD's approach involves specific test efforts (a 15-20 second maximal sprint plus several sustained efforts at different durations) and uses the mathematical model to solve for VLaMax by fitting predicted lactate kinetics to observed performance data.
A 2024 validation study in the International Journal of Sports Physiology and Performance found that INSCYD's calculated maximal lactate steady state power (PMLSS) was within a mean difference of 4.6 W of laboratory-measured values, with a correlation of r = 0.992. This validates the model output (PMLSS), not VLaMax directly.
Limitations
VLaMax is not reliably measurable without blood lactate or sophisticated modeling. A simplified sprint/threshold ratio provides only a rough directional estimate. Research has shown that even the gold-standard 15-second sprint test has only moderate reliability (CV of 18.6%, ICC of 0.661 per Harnish et al., 2023), primarily because:
- Blood lactate measurement is sensitive to timing (peak lactate may be missed)
- Blood volume affects lactate concentration independent of production rate
- The athlete must produce a truly maximal sprint, which is difficult to verify
- Nutrition and glycogen status substantially affect results
Sprint duration affects VLaMax estimates. VLaMax can peak at durations ranging from 3 to 30 seconds depending on the individual. A fixed 15-second protocol will correctly identify VLaMax approximately half the time.
The Mader model is a simplification of reality. It does not fully capture:
- Lactate shuttle dynamics (lactate is not merely a waste product but a fuel)
- Intramuscular buffering capacity (which affects blood lactate appearance independent of production rate)
- Slow and fast muscle fiber recruitment patterns
- The role of fat oxidation as a modulator of glycolytic flux
INSCYD's model is proprietary. The exact equations and calibration procedures are not fully published in peer-reviewed literature. Independent validation remains partial.
A simple sprint/threshold ratio cannot replace proper testing. This calculator should be treated as a screening tool or educational demonstration, not a diagnostic instrument.
⚠️ HEALTH & TRAINING GUIDANCE
Individual results vary significantly. Consult a sports medicine professional before making changes based on these estimates.
ℹ️ IMPORTANT DISCLAIMER
This calculator is for educational purposes only and does NOT constitute medical advice. Consult qualified professionals before making changes. Individual physiology varies. You assume all risk. Must be 18+.
References
-
Mader, A. (2003). Glycolysis and oxidative phosphorylation as a function of cytoplasmic phosphorylation state and power output of the muscle cell. European Journal of Applied Physiology, 88(4-5), 317-338.
-
Mader, A. (1984). Eine Theorie zur Berechnung der Dynamik und des steady state von Phosphorylierungszustand und Stoffwechselaktivitat der Muskelzelle als Folge des Energiebedarfs. Deutsche Sporthochschule Koln.
-
Weber, S. (2003). VLaMax: The key to understanding glycolytic power in endurance sports. INSCYD Publications.
-
Hauser, T., Adam, J., & Schulz, H. (2014). Comparison of calculated and experimental power in maximal lactate-steady state during cycling. Theoretical Biology and Medical Modelling, 11, 25.
-
Harnish, C., King, D., & Swensen, T. (2023). Reliability of the 15-s maximal lactate accumulation rate (VLaMax) test for cycling. Physiologia, 3(4), 540-549.
-
Quittmann, O. J., Schwarz, Y. M., Mester, J., Foitschik, T., & Abel, T. (2024). INSCYD physiological performance software is valid to determine the maximal lactate steady state in male and female cyclists. International Journal of Sports Physiology and Performance, 19(8), 742-749.
-
Wahl, P., Manunzio, C., Garvican-Lewis, L., & Weber, S. (2022). Lactate thresholds and the simulation of human energy metabolism: Contributions by the Cologne sports medicine group in the 1970s and 1980s. Frontiers in Physiology, 13, 899670.
Scientific Validation Notes
The underlying physiology is well-established; the simplified field estimation is a heuristic approximation.
The Mader model is scientifically rigorous. Mader's work represents one of the most comprehensive mathematical treatments of exercise metabolism. The concept that VLaMax is the glycolytic counterpart to VO2max is physiologically sound and has been influential in coaching practice, particularly in cycling and triathlon. The model's predictions about how VLaMax affects threshold, fat oxidation, and carbohydrate metabolism are well-supported by empirical data.
The INSCYD implementation has emerging validation. The 2024 study by Quittmann et al. provides evidence that INSCYD can accurately predict PMLSS from field test data. However, this validates the model's output (threshold power), not the intermediate parameter (VLaMax) that the model computes internally. A model can predict threshold correctly while having compensating errors in VO2max and VLaMax estimates.
The simplified dual-method approach is the weakest link. This calculator uses two heuristic formulas averaged together, neither published nor validated against lab-measured VLaMax. Specific concerns:
- No published validation exists for estimating VLaMax from a sprint/threshold power ratio without additional data (lactate, gas exchange, or multiple test durations).
- Sprint power is confounded by neuromuscular factors. Two athletes with identical VLaMax can have very different sprint powers due to differences in muscle mass, fiber type distribution, and pedaling mechanics.
- Threshold power is a multi-factorial output. Lactate clearance capacity, economy, and training status all influence threshold independently of glycolytic power.
- Reliability concerns persist even with proper testing. The CV of 18.6% for the 15-second VLaMax test means a result of 0.5 mmol/L/s could plausibly fall anywhere from 0.41 to 0.59 mmol/L/s - a range spanning meaningfully different physiological profiles.
Note: The calculator collects VO2max for context but derives VLaMax from sprint power and body mass alone. The "threshold as % VO2max" output uses a fixed linear formula (92 - VLaMax × 20) rather than the entered VO2max value. This means two athletes with similar sprint/threshold ratios but different aerobic capacities will receive the same VLaMax estimate.