Weight vs Performance Impact
The Science Behind It
How the Calculator Works
Inputs
- Sport: Running or Cycling (Climbing)
- Current body weight (kg, range 40-200)
- Target body weight (kg, range 40-200)
- Sex: Male or Female - used to select the allometric scaling exponent and body fat zone thresholds
- Body fat % (optional, 3-50%): enables body composition analysis and risk zone display
Running-specific:
- Current race pace (MM:SS per km)
- Race distance: 5K, 10K, Half Marathon, Marathon
Cycling-specific:
- Threshold Power (watts, range 50-600)
Running Model
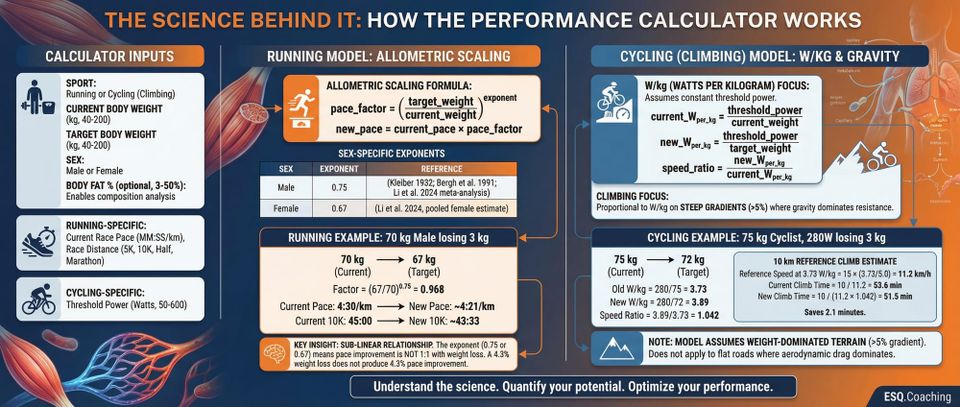
The calculator applies allometric scaling to predict how pace changes with body weight:
pace_factor = (target_weight / current_weight)exponent
new_pace = current_pace × pace_factor
The exponent is sex-specific:
- Male: 0.75 (Kleiber 1932; Bergh et al. 1991; Li et al. 2024 meta-analysis)
- Female: 0.67 (Li et al. 2024, pooled female estimate)
For example, a 70 kg male runner losing 3 kg to 67 kg:
- Factor = (67/70)0.75 = 0.968
- A 4:30/km pace becomes approximately 4:21/km
- A 45:00 10K becomes approximately 43:33
The percentage improvement is less than the percentage of weight lost because the sub-linear exponent (0.75 or 0.67) means the relationship is not 1:1. A 4.3% weight loss does not produce 4.3% pace improvement.
The calculator also outputs:
- Predicted new pace (MM:SS/km)
- Pace difference per km (seconds)
- Current race time and predicted race time for the selected distance
- Total time saved or added
Cycling (Climbing) Model
For cycling, the calculator works with W/kg (watts per kilogram) rather than allometric scaling. It assumes threshold power remains constant:
current_Wper_kg = threshold_power / current_weight
new_Wper_kg = threshold_power / target_weight
speed_ratio = new_Wper_kg / current_Wper_kg
Climb speed is assumed proportional to W/kg on steep gradients (>5%) where gravity dominates resistance. The time estimate uses a 10 km reference climb, with reference climbing speed derived from W/kg:
reference_speed (km/h) = 15 × (current_Wper_kg / 5.0)
current_climb_time = 10 / reference_speed
new_climb_time = 10 / (reference_speed × speed_ratio)
For example, a 75 kg cyclist with 280W threshold losing 3 kg to 72 kg:
- Old W/kg = 280/75 = 3.73
- New W/kg = 280/72 = 3.89
- Speed ratio = 3.89/3.73 = 1.042
- Reference speed at 3.73 W/kg = 15 × (3.73/5.0) = 11.2 km/h
- 10 km climb at 11.2 km/h = 53.6 min; at 11.7 km/h = 51.5 min; saves 2.1 minutes
The model assumes weight-dominated terrain (gradient above ~5%). On flat roads, aerodynamic drag dominates and this model does not apply.
Body Composition Model
When body fat % is entered, the calculator estimates how composition changes alongside weight:
Weight loss: 75% of lost mass comes from fat, 25% from lean tissue (assumes training plus adequate protein intake).
Weight gain: 50% fat mass, 50% lean mass (typical mixed gain without specific lean-mass programming).
fat_change = weight_change × fat_ratio
lean_change = weight_change × (1 − fat_ratio)
new_fat_mass = current_fat_mass + fat_change
new_lean_mass = current_lean_mass + lean_change
target_body_fat_pct = new_fat_mass / target_weight × 100
The output table shows current and predicted values for body weight, body fat %, fat mass (kg), and lean mass (kg).
Body Fat Risk Zones
The calculator classifies body fat against sex-specific thresholds based on ACE/ACSM/IOC guidelines:
Male zones:
| Zone | Range | Risk |
|---|---|---|
| Essential Fat | 0-5% | High |
| Competition | 5-8% | Caution |
| Athletic | 6-15% | Optimal |
| Fitness | 15-20% | Good |
| Healthy | 20-25% | Acceptable |
| Elevated | 25-40% | Elevated |
Female zones:
| Zone | Range | Risk |
|---|---|---|
| Essential Fat | 0-12% | High |
| Competition | 12-16% | Caution |
| Athletic | 14-22% | Optimal |
| Fitness | 22-28% | Good |
| Healthy | 28-32% | Acceptable |
| Elevated | 32-45% | Elevated |
Note: The Competition and Athletic zones intentionally overlap (male: 6-8%; female: 14-16%). Athletes in peak competitive condition often sit at the boundary, and the overlap reflects that real-world classification is not crisp at zone edges.
A visual risk bar plots current and target body fat against these zones. The calculator shows zone transitions (e.g., "Athletic -> Competition") and triggers health warnings if the target falls in the Essential Fat zone.
Safety Guards
Three warning tiers fire based on calculated results:
- Weight change >10% of body weight: Critical warning citing RED-S risk (Mountjoy et al. 2018). Medical supervision strongly recommended.
- Weight change >5% of body weight: Standard warning recommending no more than 0.5-1% per week to minimize muscle loss.
- Target body fat in Essential Fat zone: Critical warning that estimated body fat falls below safe thresholds, with expected performance deterioration due to muscle loss, hormonal disruption, and impaired recovery.
Practical Application
Scenario 1: Marathon runner considering race-weight optimization
- Current: 72 kg male, 3:30 marathon (5:00/km)
- Target: 69 kg (gradual fat loss over 12 weeks)
- Factor = (69/72)0.75 = 0.969
- Predicted new time: 3:30:00 × 0.969 = approximately 3:23:23 (saving roughly 6.5 minutes)
- Reality check: This assumes the weight loss is mostly fat and training quality is maintained. If muscle mass is lost, the prediction overestimates the improvement.
Scenario 2: Cyclist targeting a mountain sportive
- Current: 78 kg, Threshold Power 260W (3.33 W/kg)
- After 4 kg loss: 74 kg, same power (3.51 W/kg)
- Speed ratio = 3.51/3.33 = 1.054
- Reference climb speed at 3.33 W/kg = 15 × (3.33/5.0) = 10.0 km/h
- 10 km climb time: 60.0 min now vs 56.9 min at target - saving about 3 minutes
Scenario 3: When weight loss hurts performance
- A lean female runner at 52 kg and 15% body fat drops to 49 kg
- Body composition model: 3 kg loss = 2.25 kg fat + 0.75 kg lean (75/25 split)
- New fat mass = 7.8 - 2.25 = 5.55 kg; new body fat = 5.55/49 = 11.3% - Essential Fat zone
- The calculator fires a critical RED-S warning and shows a zone transition from Athletic to Essential Fat
- Performance benefit predicted by the formula is undermined by the loss of lean tissue and hormonal disruption
Why This Matters
Every endurance athlete understands that carrying less weight should make you faster. But by how much? And does that hold equally for running a 10K, climbing a mountain pass, and riding a flat time trial? The relationship is not proportional. A 1 kg loss does not produce 1% improvement in all conditions. The exponent matters. The gradient matters. The composition of the weight you lose matters most of all.
The Research
Running: Allometric Scaling
The allometric scaling approach treats running performance as following a power-law relationship with body mass. The general form is:
new_pace_factor = (target_weight / current_weight)exponent
Origin of the exponents. The 0.75 exponent derives from Kleiber's Law (1932), which describes basal metabolic rate scaling with body mass across mammals: BMR is proportional to mass0.75. Bergh et al. (1991) applied allometric scaling principles specifically to running oxygen uptake in humans.
Sex-specific values. Li et al. (2024) conducted a systematic review and meta-analysis of allometric exponents for scaling running economy across human samples. Key pooled estimates:
- All subjects: 0.75 (95% CI: 0.71-0.78)
- Males: 0.75 (95% CI: 0.70-0.81)
- Females: 0.67 (95% CI: 0.60-0.75)
The calculator implements these sex-specific values directly: 0.75 for male, 0.67 for female.
Attribution note. The exponents come from Kleiber (1932), Bergh et al. (1991), and the Li et al. (2024) meta-analysis - not from Daniels' Running Formula. Daniels' VDOT system uses VO2max expressed in mL/kg/min, which implicitly scales with body weight, but Daniels does not present a weight-to-pace power law. The allometric exponent is a distinct result from the scaling literature.
Cycling: Power-to-Weight on Climbs
On a steep climb where aerodynamic drag is small relative to gravitational resistance, the power required to climb is:
Pgravity = m × g × v × sin(θ)
Rearranging for velocity: v = P / (m × g × sin(θ))
At constant power output, speed is inversely proportional to mass. The ratio of new to old speed equals the ratio of new to old W/kg:
new_speed / old_speed = new_Wper_kg / old_Wper_kg
This simplification holds well above gradients of approximately 5-6%, where gravity accounts for more than 80% of total resistance. Below that gradient, aerodynamic drag becomes significant and the proportional model overstates the benefit of weight loss.
Limitations
-
The exponents are population averages, not individual constants. The Li et al. (2024) review found exponents ranging from 0.60 to 0.84 depending on sex, age, testing modality, and athletic background. Using 0.75 or 0.67 for a specific individual introduces systematic error. The sex-specific values reduce but do not eliminate this uncertainty.
-
The body composition split ratios are estimates. The 75/25 fat-to-lean split for weight loss and 50/50 for weight gain are reasonable population averages. Individual response depends on training load, dietary protein, genetics, and the rate of weight change. Rapid or extreme weight loss shifts the ratio toward greater lean tissue loss.
-
The cycling model ignores aerodynamic drag. Even on steep climbs at typical speeds of 15-20 km/h, aerodynamic drag accounts for 5-15% of total resistance. The purely proportional W/kg model slightly overestimates the speed benefit of weight loss. The Martin et al. (1998) power-speed model provides more accurate predictions by including all resistance terms.
-
Flat cycling is not modeled. On flat terrain, aerodynamics dominate. The calculator applies only to climbing conditions (>5% gradient). For flat-terrain predictions, use the Power-to-Speed calculator.
-
The formula does not distinguish between race distances. The allometric exponent may be more applicable where aerobic capacity (VO2max per kg) is the primary performance determinant - roughly 5K through marathon. For shorter events where anaerobic power and neuromuscular factors dominate, or for ultra-distances where fueling and durability matter more, the relationship may differ.
-
The floor effect is modeled only through body fat zones. The calculator flags Essential Fat zone targets and fires safety warnings, but the body fat zone boundaries are derived from population reference data rather than individualized performance modeling. Some athletes experience performance decline before reaching Essential Fat thresholds; others tolerate competition-lean body fat without hormonal disruption, depending on prior adaptation and energy availability.
⚠️ HEALTH & SAFETY WARNING
This calculator involves training modifications that can affect your health and performance if misapplied. Consult qualified professionals before making changes.
Medical consultation required if: You have underlying health conditions, are taking medications, pregnant/nursing, under 18, or experience adverse symptoms during training.
ℹ️ IMPORTANT DISCLAIMER
This calculator is for educational purposes only and does NOT constitute medical advice. Consult qualified professionals before making changes. Individual physiology varies. You assume all risk. Must be 18+.
References
Bergh, U., Sjodin, B., Forsberg, A., & Svedenhag, J. (1991). The relationship between body mass and oxygen uptake during running in humans. Medicine & Science in Sports & Exercise, 23(2), 205-211.
Kleiber, M. (1932). Body size and metabolism. Hilgardia, 6(11), 315-353. https://doi.org/10.3733/hilg.v06n11p315
Li, S., Luo, J., & Yan, X. (2024). Allometric exponents for scaling running economy in human samples: A systematic review and meta-analysis. Heliyon, 10(10), e31091. https://doi.org/10.1016/j.heliyon.2024.e31091
Martin, J. C., Milliken, D. L., Cobb, J. E., McFadden, K. L., & Coggan, A. R. (1998). Validation of a mathematical model for road cycling power. Journal of Applied Biomechanics, 14(3), 276-291. https://doi.org/10.1123/jab.14.3.276
Mountjoy, M., Sundgot-Borgen, J., Burke, L., et al. (2018). International Olympic Committee (IOC) consensus statement on Relative Energy Deficiency in Sport (RED-S). British Journal of Sports Medicine, 52(11), 687-697.
Nevill, A. M., Ramsbottom, R., & Williams, C. (1992). Scaling physiological measurements for individuals of different body size. European Journal of Applied Physiology and Occupational Physiology, 65(2), 110-117. https://doi.org/10.1007/BF00705066
Swain, D. P. (1994). The influence of body mass in endurance bicycling. Medicine & Science in Sports & Exercise, 26(1), 58-63.
Scientific Validation Notes
Sex-specific exponents: implemented. The calculator uses 0.75 for males and 0.67 for females, matching the Li et al. (2024) pooled estimates. This is more accurate than a single universal exponent, particularly for female athletes where 0.75 would overestimate the pace benefit of weight loss.
Body composition split ratios: reasonable defaults. The 75% fat / 25% lean assumption for weight loss with training is consistent with published ranges from controlled weight-loss studies in athletes. Actual ratios vary with protein intake, training volume, and rate of loss. The 50/50 gain assumption is a conservative estimate for non-targeted muscle-building programs.
Body fat zone overlap: cosmetic, not an error. The Competition (male: 5-8%) and Athletic (male: 6-15%) zones overlap at 6-8%. The same overlap exists in the female thresholds at 14-16%. This reflects ACE/ACSM category boundaries and the visual zone bar renders correctly - the calculator classifies by the first zone whose max threshold is exceeded, proceeding in order from Essential Fat upward.
Cycling climbing model: physically sound within scope. The W/kg proportionality holds well above 5% gradient. The reference speed formula (15 × W/kg / 5.0) scales the 10 km reference climb time to the athlete's actual W/kg, making the estimated time savings proportionally correct even if the absolute reference speed is approximate. On flat terrain the model does not apply.
Safety thresholds: conservative and appropriate. The 5% and 10% weight-change warnings align with RED-S literature (Mountjoy et al. 2018). The essential fat zone triggers are grounded in ACE/ACSM/IOC reference data. These are population-level flags, not individualized clinical assessments.