You vs The World
Power Profile Calculator
📋 What is a power profile?
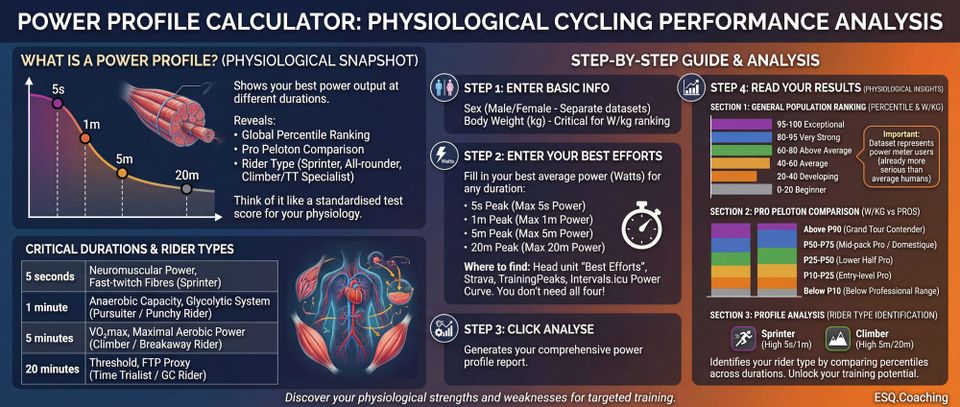
A power profile shows your best power output at different durations, compared to other cyclists. It reveals:
- Where you rank among all cyclists worldwide (percentile)
- Where you'd sit in the professional peloton
- What type of rider you are (sprinter, all-rounder, climber/TT specialist)
Think of it like a standardised test score — but for cycling. Your score at each duration tells a different story about your physiology.
| Duration | What It Tests | Rider Type if Strong |
|---|---|---|
| 5 seconds | Neuromuscular power, fast-twitch fibres | Sprinter |
| 1 minute | Anaerobic capacity, glycolytic system | Pursuiter / punchy rider |
| 5 minutes | VO₂max / maximal aerobic power | Climber / breakaway rider |
| 20 minutes | Threshold / FTP proxy | Time trialist / GC rider |
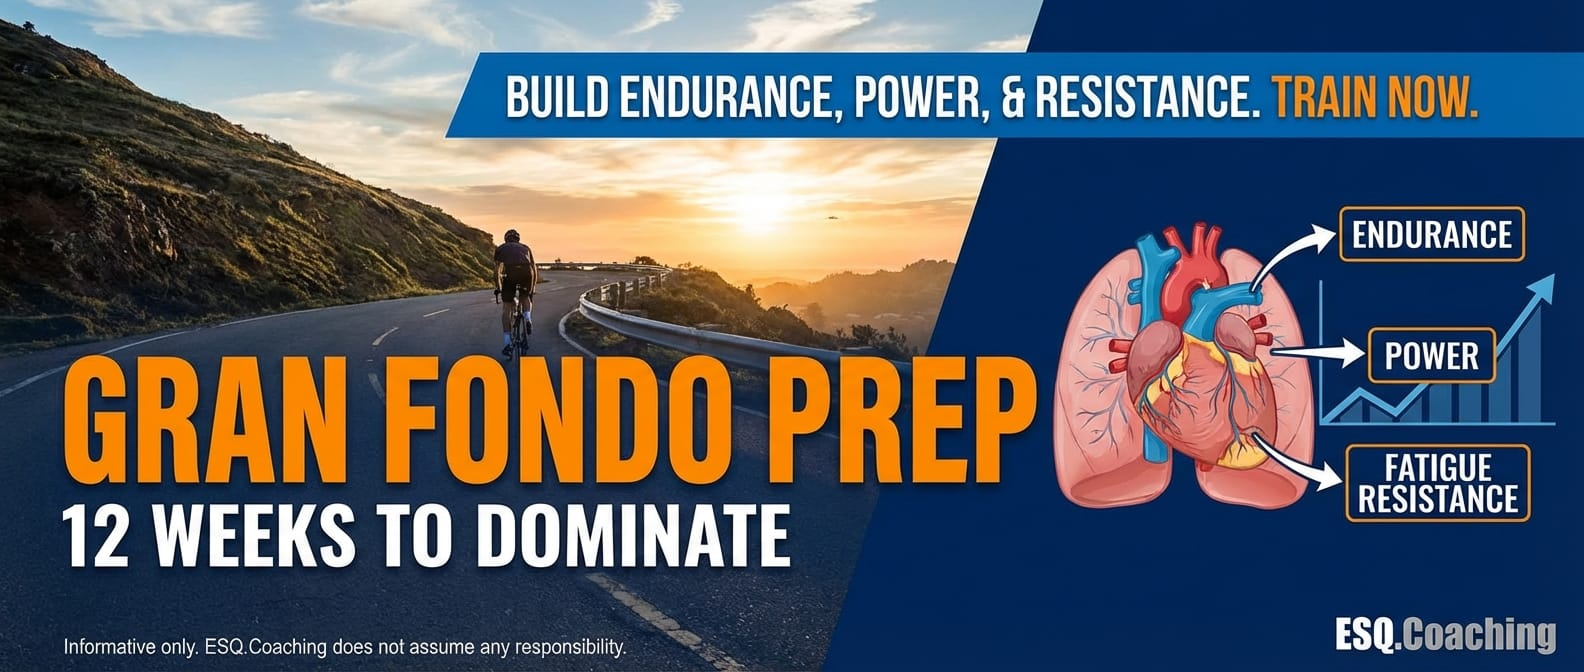
Long events don’t fail at the start. They fail late.
This 12-week Gran Fondo plan focuses on fatigue resistance, fueling under load, and holding power deep into long efforts. Not peak numbers, but repeatable performance when it counts.
Use this if you want to finish strong instead of just finishing. View Plan here
🎯 STEP-BY-STEP GUIDE
STEP 1: Enter Basic Info
- Sex: Male or Female (separate datasets and percentile tables for each)
- Body Weight (kg): Critical — all rankings are based on watts per kilogram
STEP 2: Enter Your Best Efforts
Fill in your personal best average power for any or all durations:
| Field | Duration | Where to Find It |
|---|---|---|
| 5-Second Peak | Max 5s power | Head unit "best 5s power" or sprint test |
| 1-Minute Peak | Max 1-min power | Head unit or dedicated 1-min all-out test |
| 5-Minute Peak | Max 5-min power | Head unit or VO₂max test (5-min all-out) |
| 20-Minute Peak | Max 20-min power | FTP test (20-min all-out) |
You don't need all four — even one gives you a ranking.
Where to find these values:
- Most cycling computers (Garmin, Wahoo, Hammerhead) track "Power Records" or "Best Efforts"
- Strava, TrainingPeaks, and Intervals.icu show "Power Curve" or "Mean Maximal Power"
- Use outdoor or indoor — but be consistent
STEP 3: Click "Analyse Power Profile"
STEP 4: Read Your Results
Section 1: General Population Ranking For each duration you entered, you see:
- A percentile bar (0–100)
- Your watts and W/kg
- A category label and colour
| Percentile | Category | Colour | What It Means |
|---|---|---|---|
| 95–100 | Exceptional | Purple | Top 5% of all power meter users |
| 80–95 | Very Strong | Blue | Competitive amateur racer |
| 60–80 | Above Average | Green | Serious recreational cyclist |
| 40–60 | Average | Amber | Typical among power meter users |
| 20–40 | Developing | Orange | Newer to structured training |
| 0–20 | Beginner | Grey | Just starting out |
Important context: The Cycling Analytics dataset represents power meter users, not all cyclists. If you own a power meter, you're already more serious than most. Being "50th percentile" here means average among trained cyclists, not average among all humans.
Section 2: Pro Peloton Comparison For each duration, a bar shows where your W/kg sits among professional cyclists:
| Position | What It Means |
|---|---|
| Above P90 | Top 10% of professionals — Grand Tour contender level |
| P50–P75 | Mid-pack pro — WorldTour domestique, strong stage racer |
| P25–P50 | Lower half of the pro field |
| P10–P25 | Entry-level professional power |
| Below P10 | Below professional range (this is normal) |
Section 3: Profile Analysis If you enter multiple durations, the calculator identifies your rider type by comparing percentiles across durations:
- Sprinter: 5s percentile >> 20-min percentile
- Time Trialist / Climber: 20-min percentile >> 5s percentile
- All-Rounder: Similar percentiles across all durations
- VO₂max headroom: 5-min percentile notably higher than 20-min → threshold-specific training could raise FTP
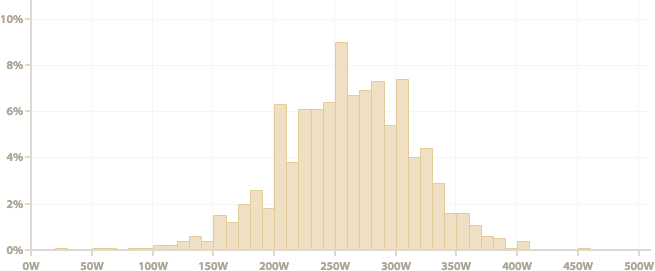
📊 REFERENCE DATA
Male General Population (W/kg) — Cycling Analytics 2018
| Percentile | 5 sec | 1 min | 5 min | 20 min | ~FTP |
|---|---|---|---|---|---|
| 99th | 19.80 | 10.29 | 6.81 | 5.80 | 5.51 |
| 95th | 17.84 | 9.11 | 6.03 | 5.13 | 4.88 |
| 90th | 16.74 | 8.55 | 5.73 | 4.86 | 4.61 |
| 80th | 15.30 | 7.84 | 5.30 | 4.50 | 4.28 |
| 50th | 12.14 | 6.49 | 4.48 | 3.80 | 3.61 |
| 20th | 9.28 | 5.23 | 3.72 | 3.11 | 2.96 |
| 5th | 6.26 | 3.90 | 2.86 | 2.39 | 2.27 |
Female General Population (W/kg) — Cycling Analytics 2018
| Percentile | 5 sec | 1 min | 5 min | 20 min | ~FTP (95% 20m) |
|---|---|---|---|---|---|
| 95th | 15.36 | 7.94 | 5.59 | 4.84 | 4.60 |
| 90th | 14.27 | 7.48 | 5.43 | 4.61 | 4.38 |
| 80th | 13.06 | 6.89 | 4.95 | 4.33 | 4.11 |
| 70th | 11.89 | 6.45 | 4.59 | 4.07 | 3.87 |
| 60th | 11.15 | 6.16 | 4.52 | 3.94 | 3.74 |
| 50th | 10.03 | 5.91 | 4.29 | 3.80 | 3.61 |
| 40th | 9.43 | 5.56 | 4.13 | 3.61 | 3.43 |
| 30th | 8.67 | 5.00 | 3.74 | 3.26 | 3.10 |
| 20th | 8.03 | 4.59 | 3.41 | 2.95 | 2.80 |
| 10th | 6.09 | 3.76 | 3.10 | 2.70 | 2.56 |
| 5th | 4.98 | 3.28 | 2.65 | 2.31 | 2.19 |
Male Professional Cyclists (W/kg) — Valenzuela et al. 2021, N=144
| Percentile | 5 sec | 1 min | 5 min | 10 min | 20 min | 30 min | 60 min |
|---|---|---|---|---|---|---|---|
| P90 | 20.83 | 11.33 | 7.65 | 7.00 | 6.59 | 6.24 | 5.76 |
| P75 | 19.78 | 10.74 | 7.34 | 6.77 | 6.29 | 6.02 | 5.47 |
| P50 | 17.99 | 10.10 | 7.06 | 6.45 | 6.03 | 5.71 | 5.15 |
| P25 | 16.59 | 9.51 | 6.75 | 6.19 | 5.79 | 5.36 | 4.91 |
| P10 | 15.71 | 8.87 | 6.52 | 5.92 | 5.47 | 5.10 | 4.71 |

Female Professional Cyclists (W/kg) — Mateo-March et al. 2022, N=44
| Percentile | 5 sec | 1 min | 5 min | 10 min | 20 min | 30 min | 60 min |
|---|---|---|---|---|---|---|---|
| P90 | 17.2 | 9.4 | 6.5 | 6.0 | 5.5 | 5.3 | 4.9 |
| P75 | 16.3 | 9.0 | 6.3 | 5.6 | 5.2 | 5.0 | 4.6 |
| P50 | 15.3 | 8.4 | 5.8 | 5.2 | 5.0 | 4.7 | 4.3 |
| P25 | 14.0 | 7.7 | 5.5 | 4.9 | 4.5 | 4.3 | 3.9 |
| P10 | 13.1 | 7.3 | 5.1 | 4.6 | 4.3 | 4.0 | 3.7 |

💡 TIPS FOR BEST RESULTS
- Use your actual best efforts, not estimated or target values
- Weight accuracy matters — 1kg error on a 70kg rider shifts W/kg by 1.4%
- Update regularly — power records from 2 years ago may not reflect current fitness
- Compare like-for-like: indoor and outdoor bests can differ by 5–10%
- Don't cherry-pick: entering a tailwind-assisted 20-min effort gives a misleading profile
🔧 TROUBLESHOOTING
| Problem | Cause | Fix |
|---|---|---|
| All durations show "Beginner" | Weight entered in lbs instead of kg | Convert to kg (divide by 2.2) |
| Sprint percentile much higher than threshold | Normal — you're a sprinter type | Focus threshold training to balance |
| "Below pro field" for everything | Normal for 99.9% of cyclists | Use general population ranking instead |
| No pro comparison shown | Duration not available in pro data | Only 5s, 1m, 5m, 20m have both datasets |
Disclaimer
The information provided in this newsletter is for educational purposes only and does not constitute medical advice. Exercise physiology is highly individual; what works for elite populations may not apply to everyone. Always consult with a physician before making significant changes to your training, nutrition, or supplementation protocols. The Scientist's Notebook and ESQ Coaching accept no liability for injuries or health issues arising from the application of these concepts.