Introducing Gradescale: An Endurance Analytics Platform That Shows Its Work

A contribution to the science-curious end of the endurance community
Over the past few months, this corner of the endurance world has been working through one half of a workflow.
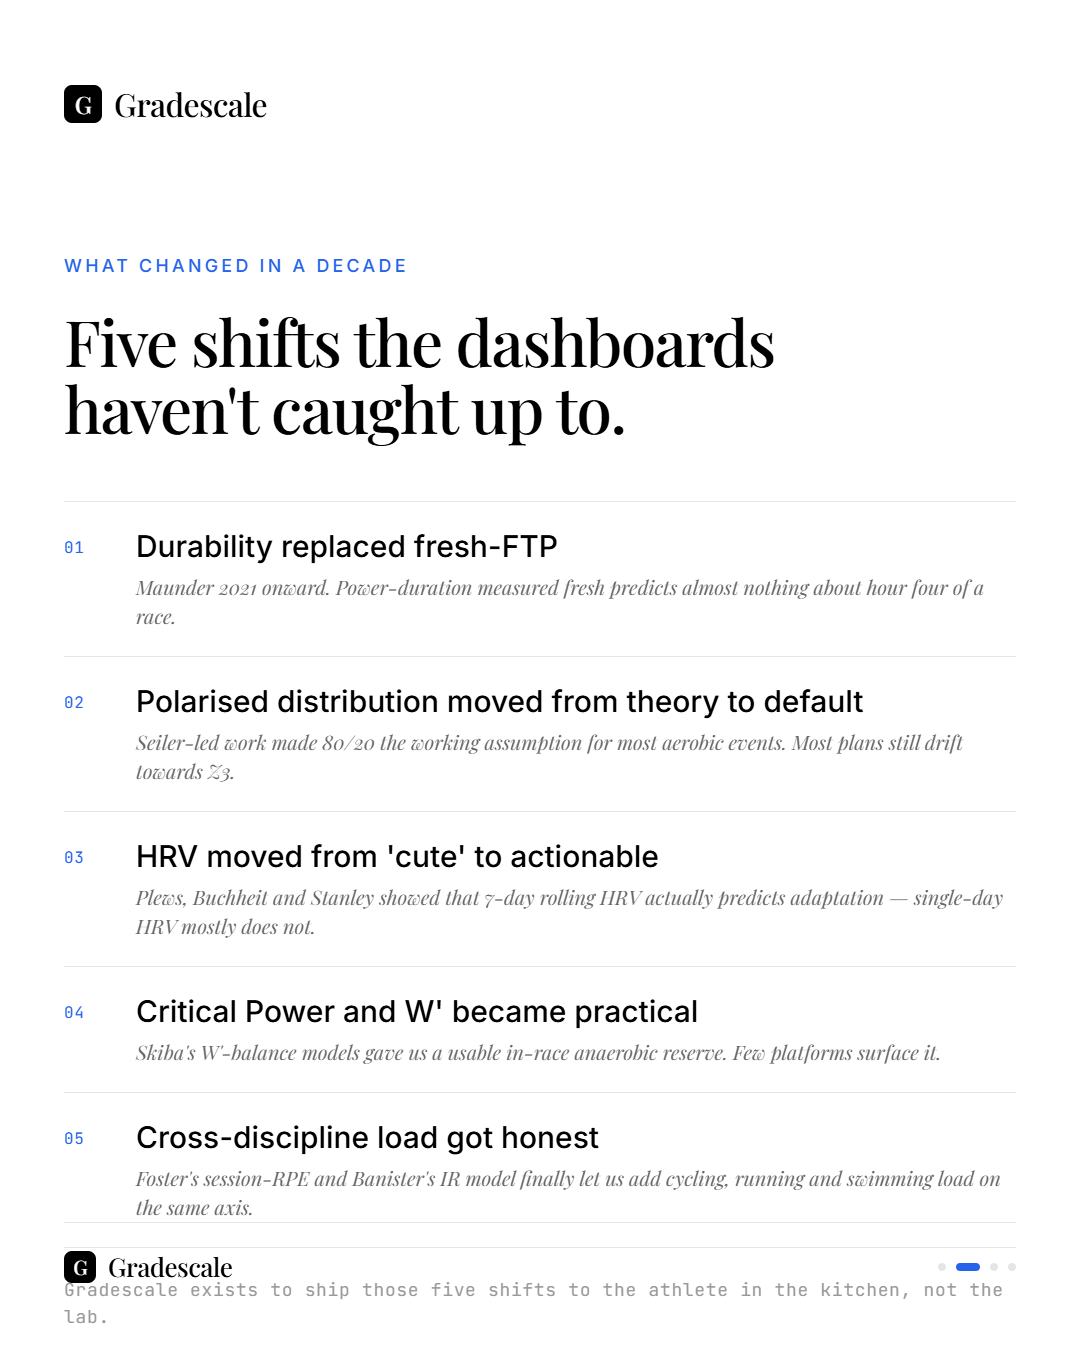
The half this newsletter explores is the science. Physiology, dose-response curves, how stimuli actually drive adaptation, the difference between what the studies say and what our watches and apps decide to display. The half rarely written about here is the harder one:
How do any of us actually see that science in our own training data?
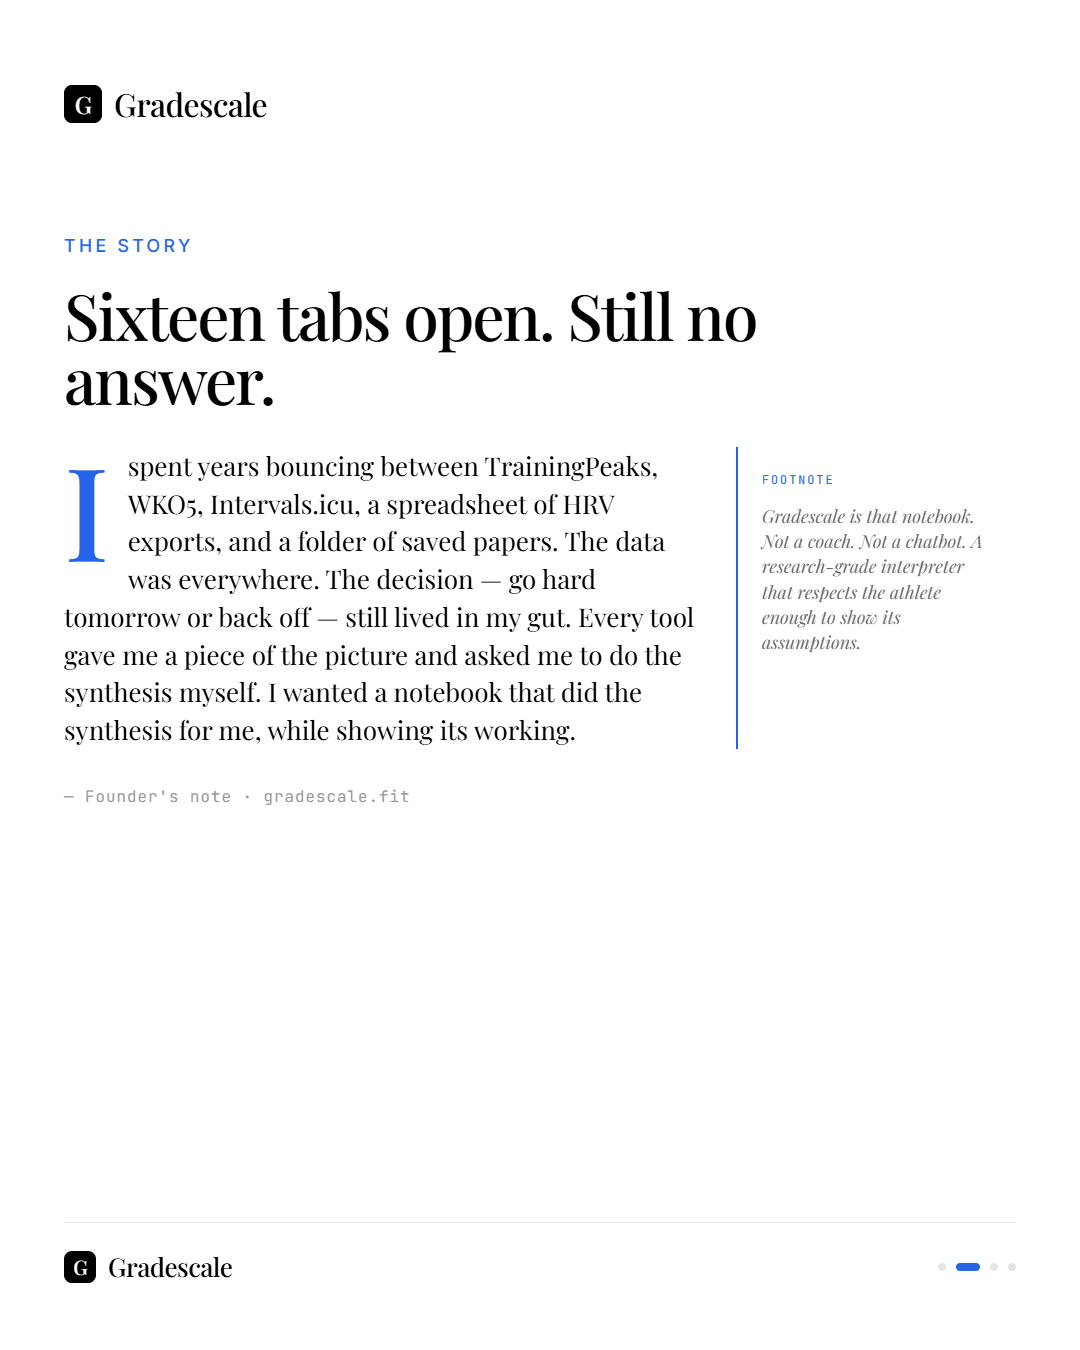
Coaches, applied physiologists, and serious age-group athletes have been circling that question for a long time. Most analytics tools either reduce the science to a single proprietary score, or hide their methodology inside a desktop application that takes weeks to learn.
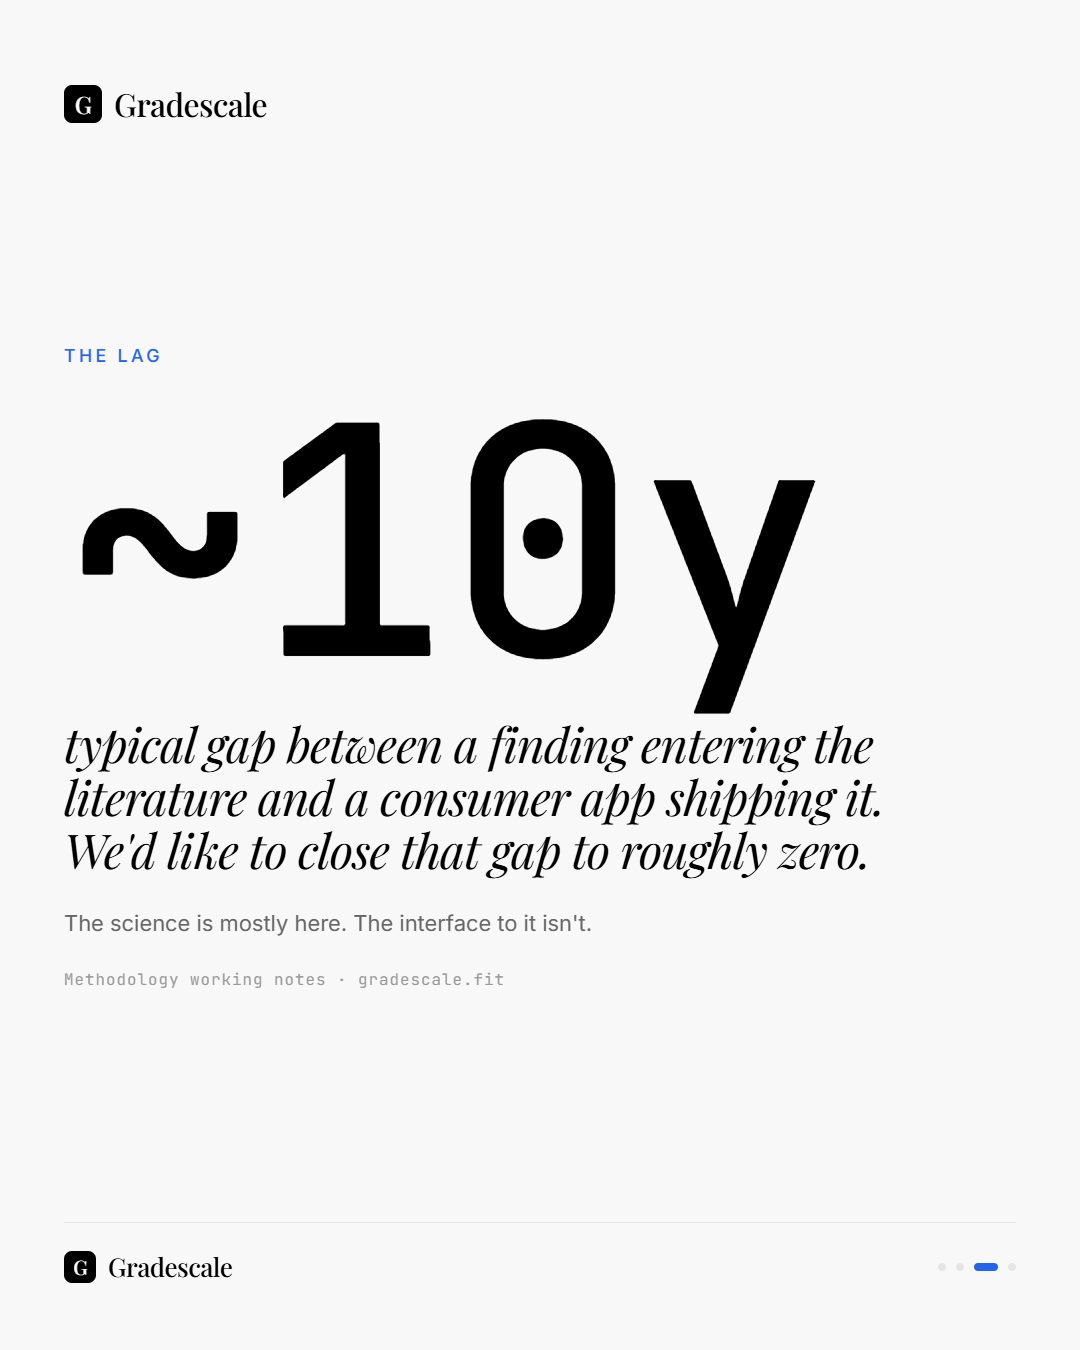
There is a gap between what the literature lets us see and what most platforms let us do.
Gradescale is one attempt to close that gap, offered as a contribution to the conversation rather than a closed product.
What it is
Gradescale is a browser-based analytics platform for endurance athletes, covering cycling, running, and triathlon. You bring your training data, and the platform delivers the kind of analysis usually reserved for coaches running expensive desktop software, inside a workspace that opens in a browser tab.
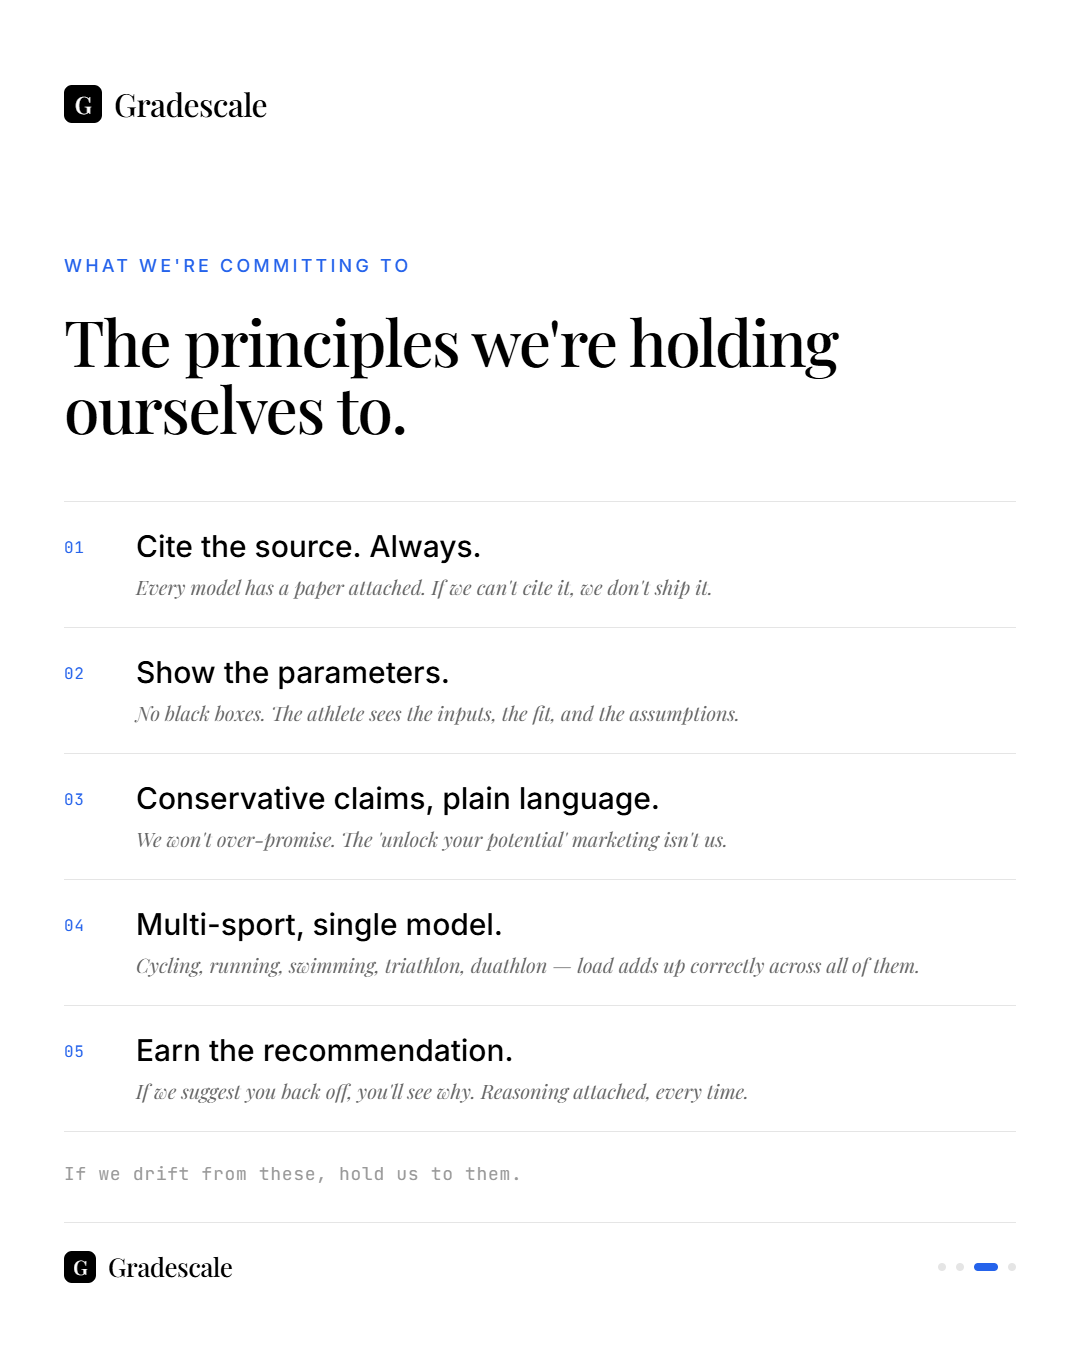
What sets it apart is not breadth. Most platforms have long feature lists. What sets it apart is that every metric, every model, every default chart is traceable to the literature.
- Why is a power-duration curve fit using this model and not that one? Documented.
- Why does this fatigue construct sit at the centre of the load view instead of the more common one? Documented.
- Why does an aerobic threshold estimate hold up under one kind of session and break down under another? Documented.
- None of it is "proprietary scoring." All of it is auditable.
That is the same standard this newsletter has tried to hold itself to. If a claim does not survive contact with the literature, it does not go in the Notebook. The same rule now runs the analytics engine.
Development is happening in the open. Methodology is documented. Decisions are open to scrutiny from the community of athletes, coaches, and researchers reading this. The project assumes a reader who is sceptical, well-read, and not satisfied with marketing copy.
Where it is
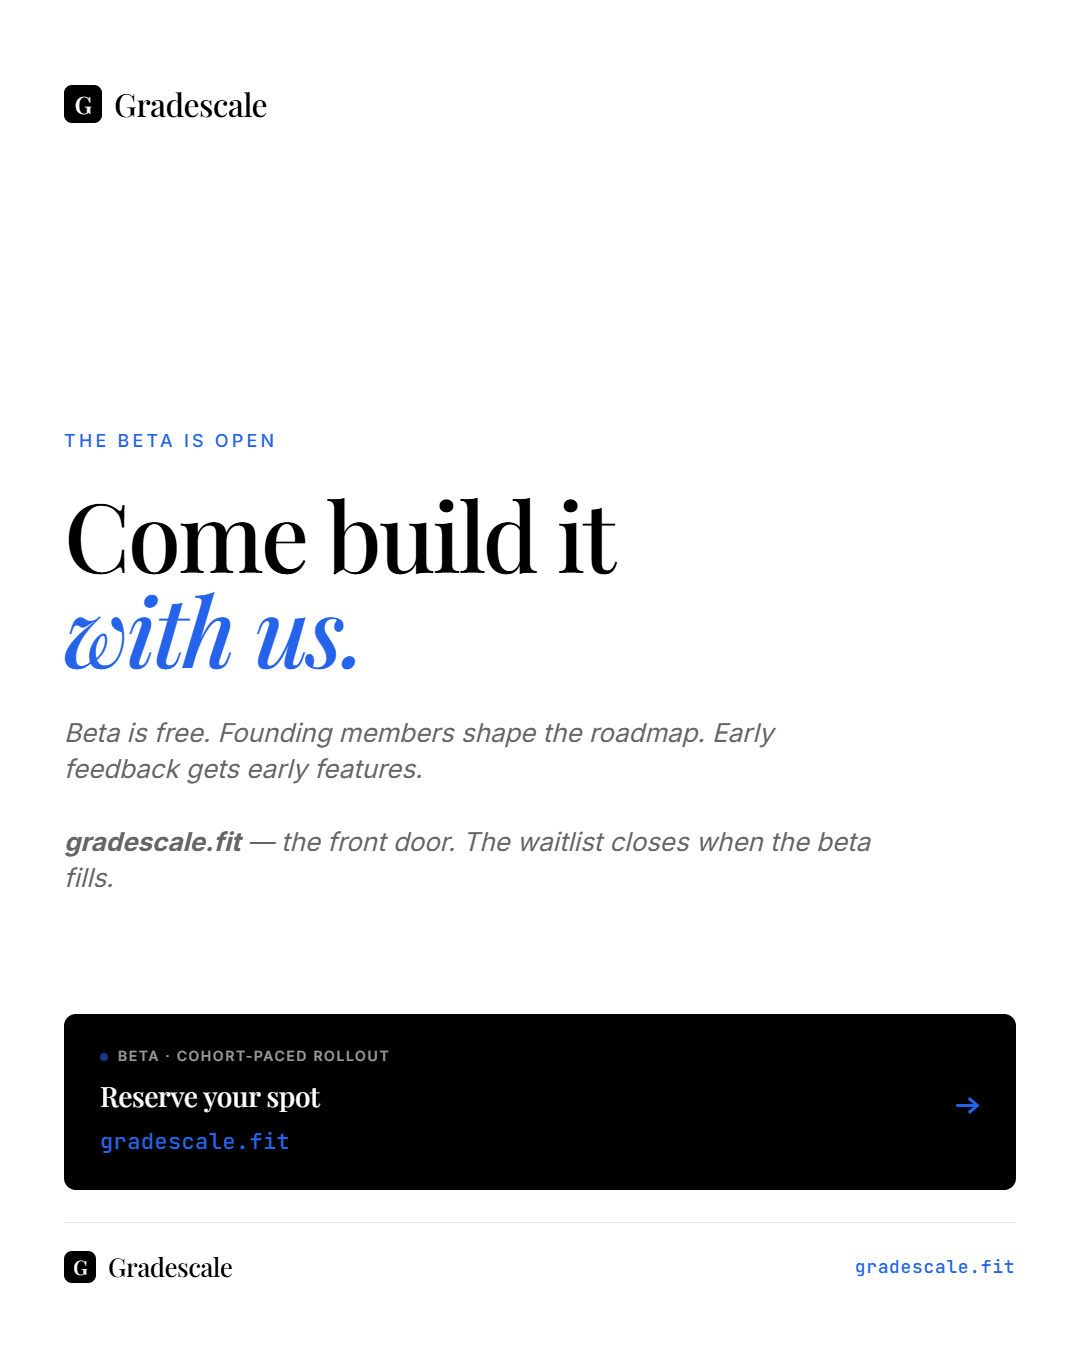
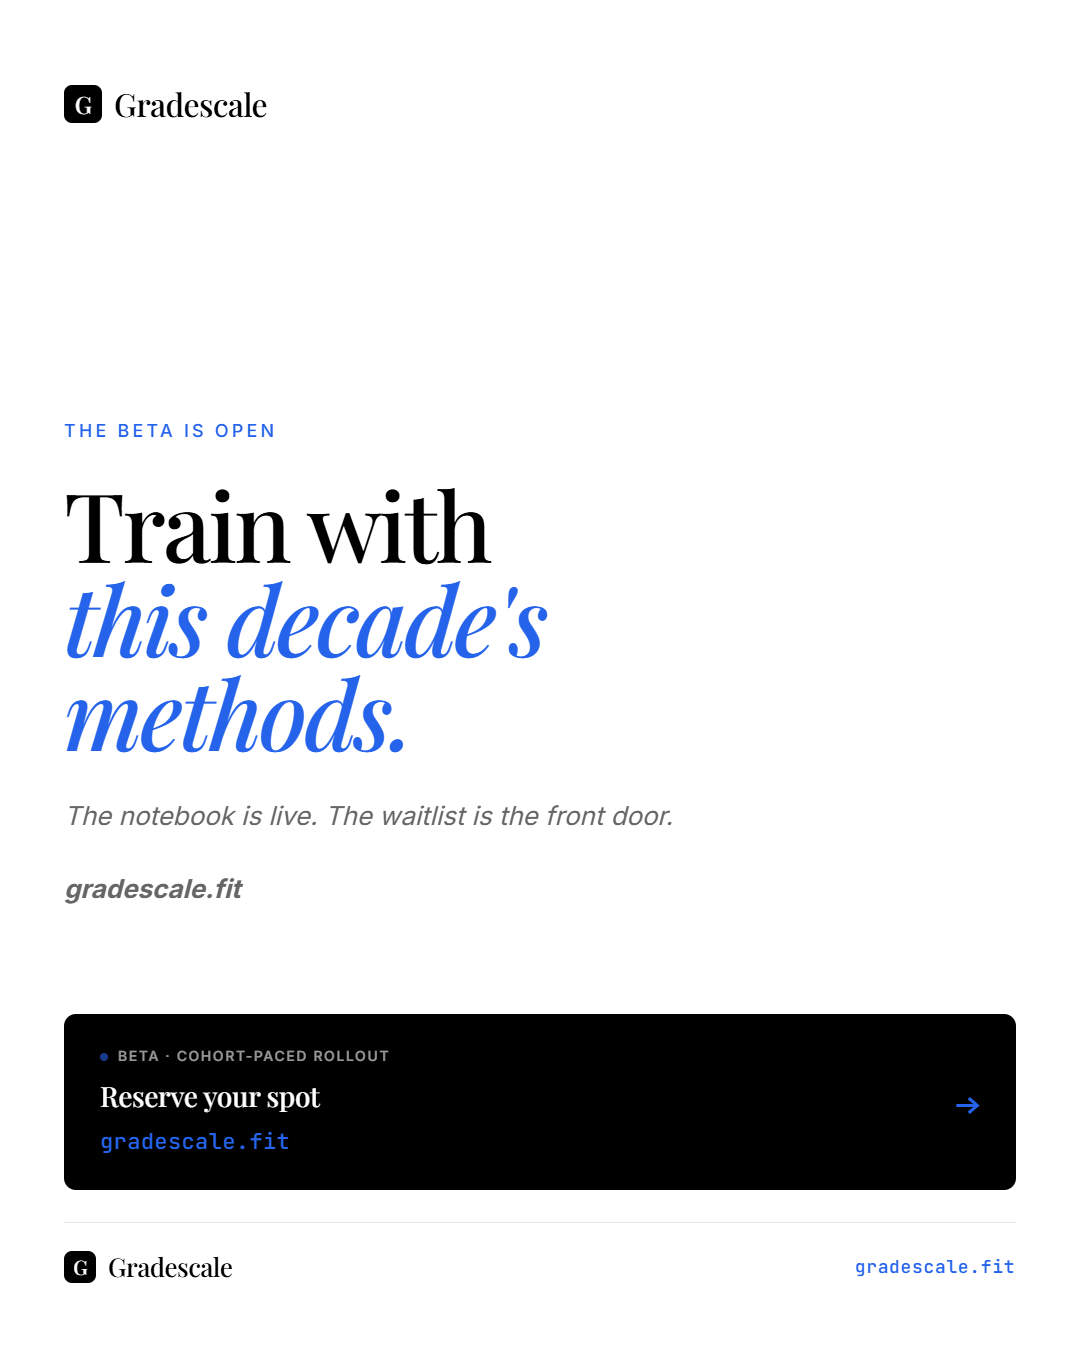
Gradescale is pre-launch. The platform is built and deep into testing. Two things are open now:
- gradescale.fit is live for early signups. Adding an email there is the way to be first in line when the platform opens.
- @gradescale.fit on Instagram is where the day-to-day development, methodology breakdowns, and behind-the-scenes work will live between now and public launch.
You are already following The Scientist`s Notebook for the science, Gradescale is where that science gets translated into analyses you can run on your own files.
The two accounts are deliberately separate. The Notebook is the journal. Gradescale is the workshop.
How to join in
- Add your email at gradescale.fit to be on the early-access list at launch.
- Follow @gradescale.fit on Instagram for development updates and methodology walkthroughs along the way.
The science does not stop here. It just gets somewhere to land.
Dr. Thomas Mortelmans
Found this useful?
Get articles like this and free training calculators in your inbox every week.
Recommended reads
If this was useful, these are the other research-driven newsletters I actually read.
Member discussion