Entry #020: Methodological Variance in Lactate Threshold Determination
Insane. What a journey so far already. 20 Entries and so much community engagement! It has been an absolute pleasure to have you on this journey. Thank you again for the feedback and making this community grow to what it is today!
In this Entry, we will tackle the determination of lactate thresholds as they represent a fundamental paradox in exercise physiology: the concept is central to training prescription, the methodology for its assessment remains fraught with variability.
The assumption that a 'threshold' exists as a singular, immutable physiological constant is challenged by evidence demonstrating that identified breakpoints are often artifacts of specific testing protocols and mathematical models.
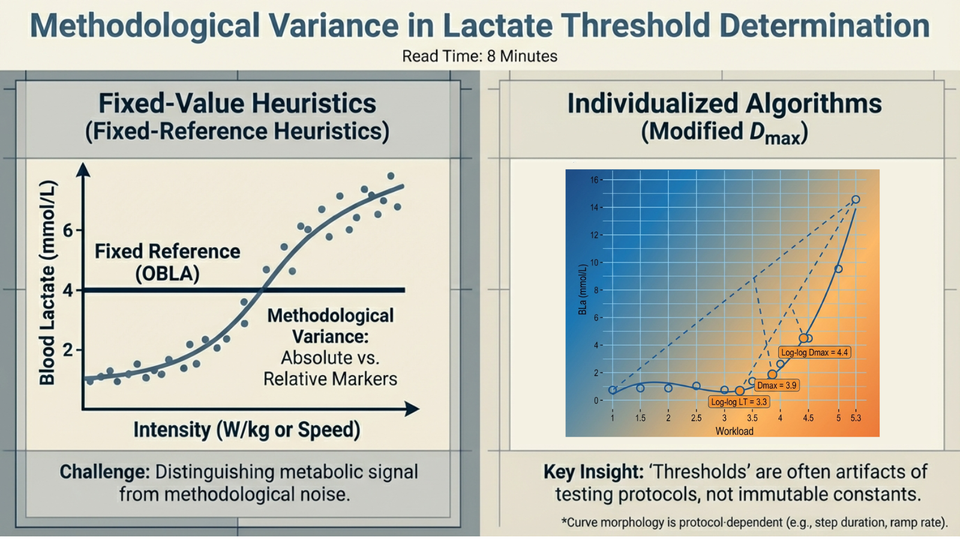
For the sport scientist and high-performance coach, the challenge lies not merely in collecting blood lactate data, but in navigating the discordance between fixed-value heuristics (e.g., 4 mmol/L) and individualized curve-fitting algorithms (e.g., Modified Dmax).
This briefing dissects the validity, reliability, and physiological fidelity of contemporary determination methods, distinguishing between metabolic signal and methodological noise.
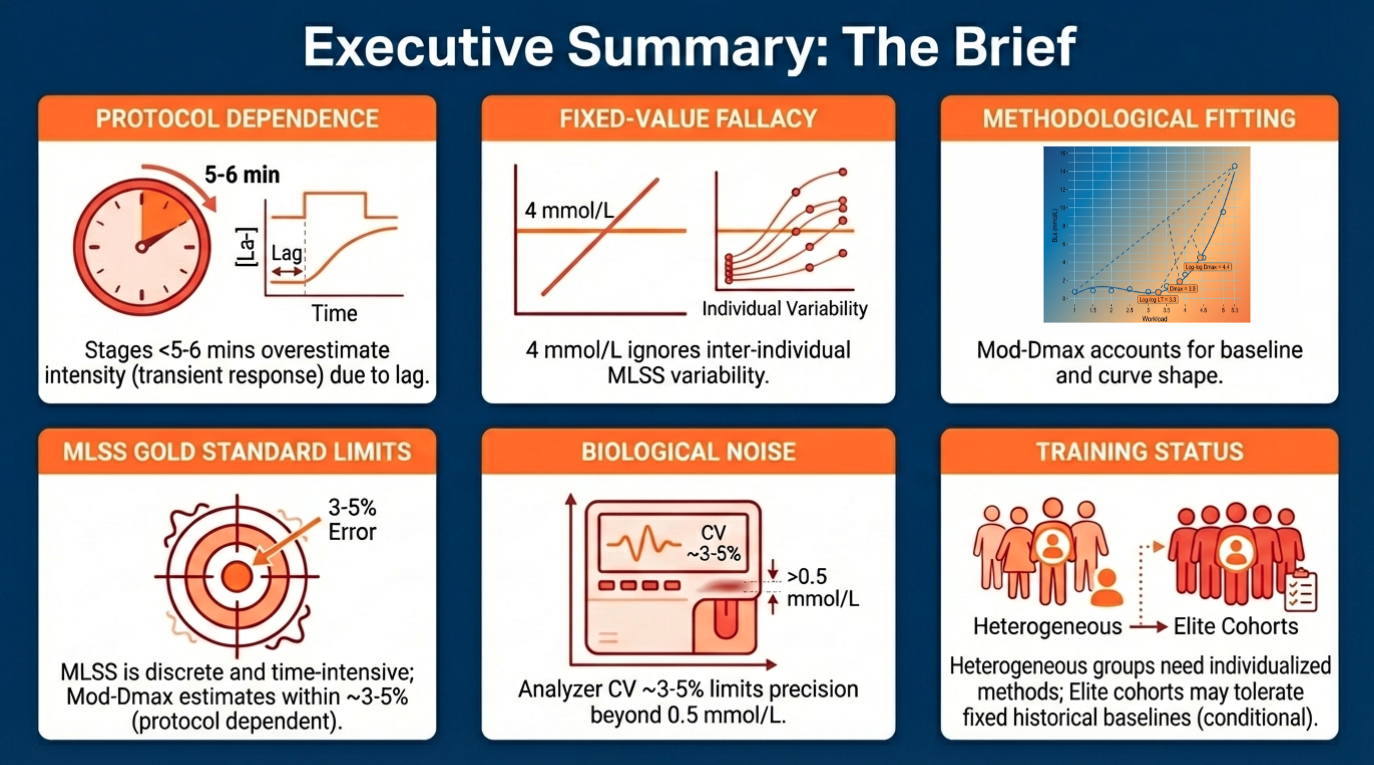
Executive Summary – The Brief:
• Protocol Dependence: The identified lactate threshold is significantly influenced by stage duration; stages shorter than 5-6 minutes may fail to capture true steady-state kinetics, potentially overestimating threshold intensity by measuring transient responses.
• The Fixed-Value Fallacy: The traditional 4 mmol/L (OBLA) method is often an artifact of specific historical protocols. It frequently underestimates thresholds in lowly trained populations and fails to account for inter-individual variability in maximal lactate steady state (MLSS), which is rarely exactly 4.0 mmol/L.
• Mathematical Superiority: The Modified Dmax method demonstrates high reliability and predictive validity for cycling performance, offering a geometrically intuitive alternative to arbitrary fixed values by accounting for the individual's baseline and curve shape.
• The Gold Standard Limitation: While Maximal Lactate Steady State (MLSS) remains the physiological criterion, it yields discrete data (stepwise) and is time-intensive. Validated incremental protocols (e.g., Mod-Dmax) estimate MLSS with acceptable limits of agreement (typically within 3-5% error).
• Biological Noise: Measurement accuracy is compromised by analyzer variability (CV ~3-5%), sampling site (capillary vs. venous), and hydration status. Precision beyond 0.5 mmol/L is often analytically unsupportable due to biological oscillation.
• Training Status Interaction: Heterogeneous populations require individualized methods (e.g., Log-Log, Baseline+); homogeneous elite cohorts may tolerate fixed methods only if protocols are rigidly standardized to historical baselines.
The Science at a Glance:
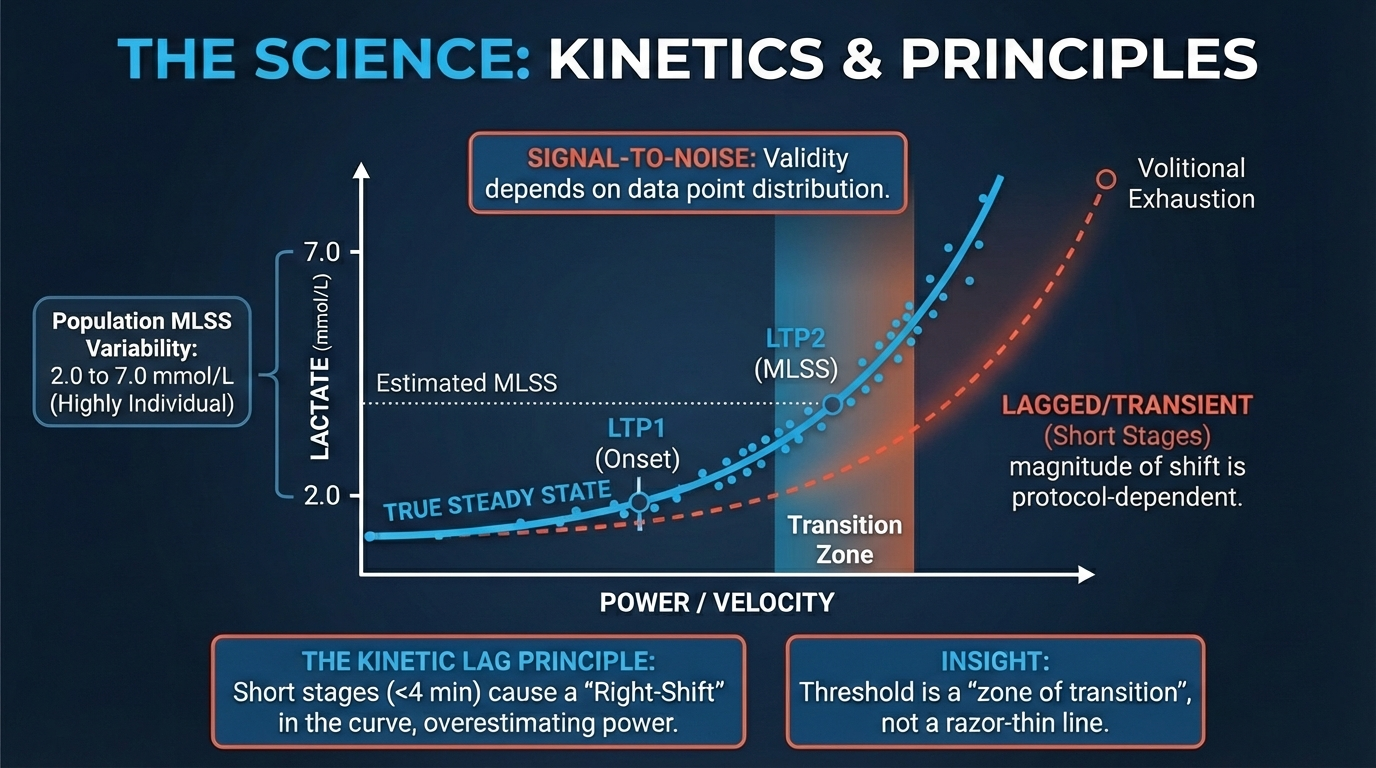
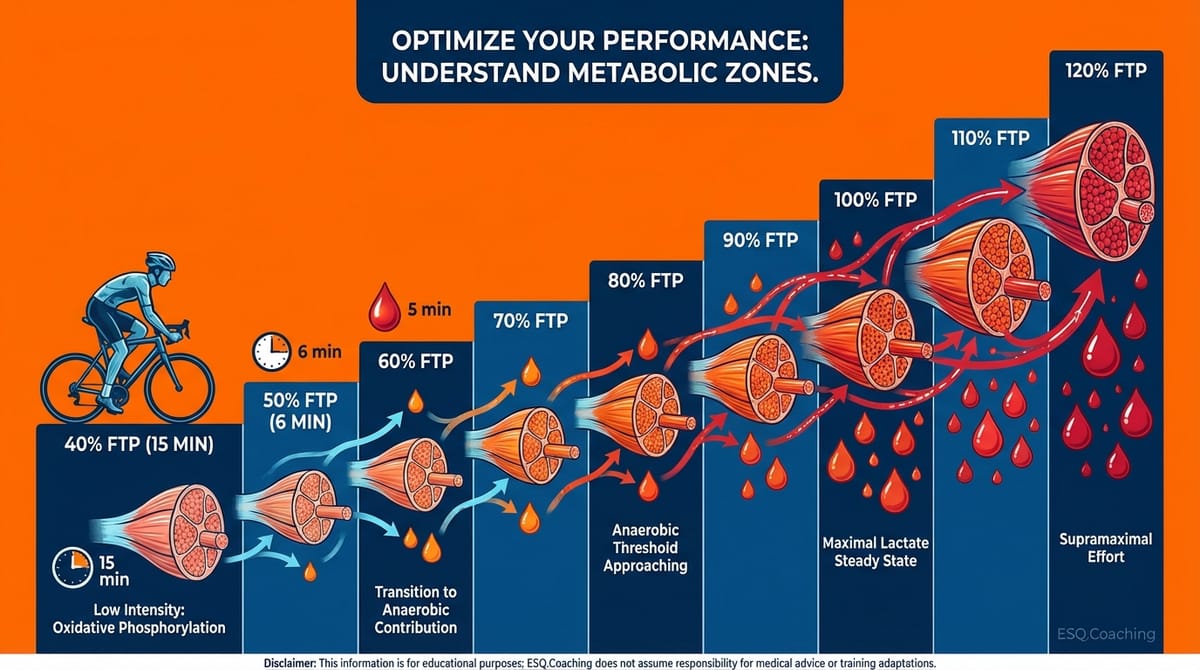
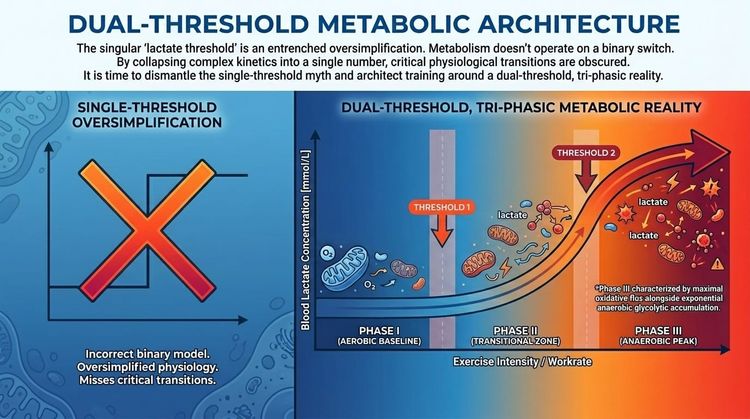
The physiological transition from aerobic stability to metabolic instability is characterized by two distinct breakpoints: Lactate Turnpoint 1 (LTP1/LT1), marking the onset of sustained lactate accumulation above resting baseline, and Lactate Turnpoint 2 (LTP2/LT2), representing the maximal lactate steady state (MLSS).
While early methodologies sought to simplify these transitions into fixed absolute values (e.g., 2 and 4 mmol/L), contemporary research confirms that lactate kinetics are non-linear and highly individual.
• The concentration at MLSS can range from approximately 2.0 to 7.0 mmol/L across healthy individuals, rendering fixed-value approaches physiologically invalid for a significant portion of the athletic population.
• Modern determination methods utilize polynomial curve fitting (Modified Dmax) or log-log transformations to identify breakpoints based on the rate of accumulation and geometric properties of the curve, rather than arbitrary absolute concentrations.
• This shift moves assessment from a 'one-size-fits-all' diagnostic to an individualized physiological profile.
Foundational Princips:
1. The Kinetic Lag Principle: Blood lactate concentration is a lagging indicator of muscle metabolic state.
During incremental testing, insufficient stage duration (<4 minutes) prevents the full equilibration of production and clearance compartments (blood-muscle gradient), leading to a right-shift in the curve and an overestimation of power/velocity at threshold.
2. The Signal-to-Noise Ratio in Curve Fitting: Mathematical methods (Log-Log, Dmax) rely on the shape of the entire data set. Consequently, their validity is sensitive to the number of data points (increment size) and the distribution of points across the aerobic and severe domains. Sparse data sampling introduces significant error in polynomial regression models.
Scientist`s Insight: We must distinguish between the physiological phenomenon (MLSS) and the mathematical proxy used to estimate it. The Modified Dmax method is currently a robust proxy for cycling, showing strong agreement with MLSS.
However, practitioners must accept that 'threshold' is a zone of transition, not a razor-thin line. The precision of any method is ultimately limited by the biological oscillation of lactate (approx. ±0.2-0.5 mmol/L) and the analytical error of portable devices.
The Decision Matrix
The Protocol:
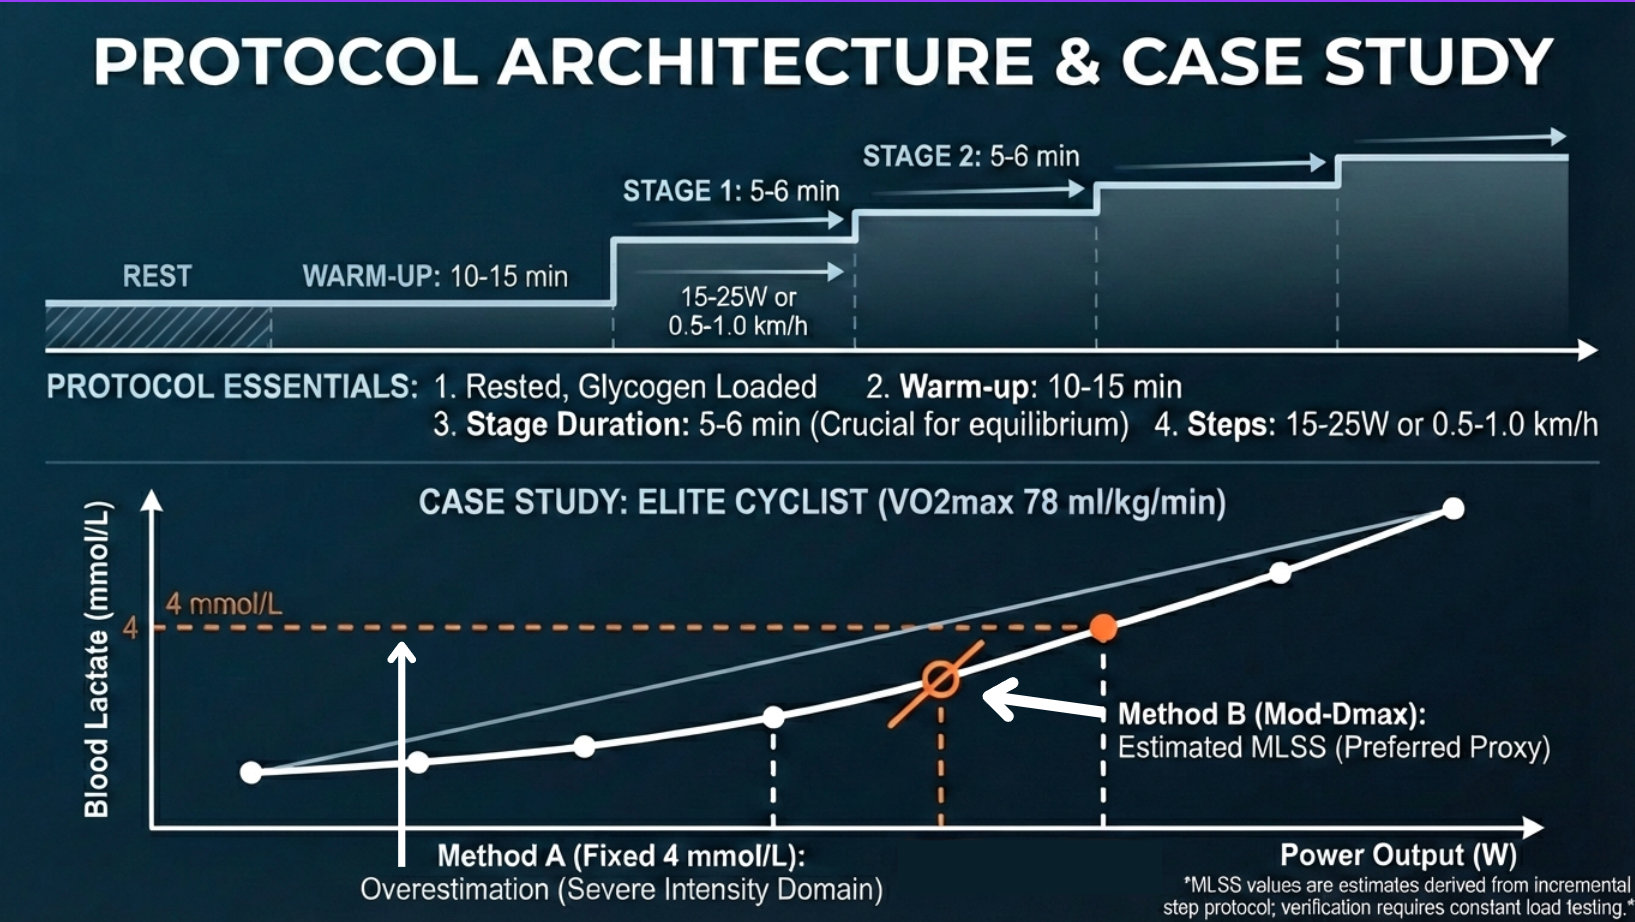
To maximize the validity of the Modified Dmax or Baseline Plus methods, the following test architecture is required:
1. Pre-Test Standardization: Athlete must be in a rested, glycogen-loaded state. Glycogen depletion lowers absolute lactate values, potentially shifting the curve rightward or suppressing peak values, artificially inflating the perceived threshold intensity.
2. Warm-up: 10-15 minutes at low intensity to mobilize oxidative enzymes and establish a true resting baseline.
3. Stage Duration: Minimum 5-6 minutes per stage is recommended for MLSS estimation. Shorter stages (3 min) may reflect acute accumulation rates rather than equilibrium, though they are common in commercial settings.
4. Increment Sizing: 15-25 Watts (cycling) or 0.5-1.0 km/h (running). Large jumps reduce resolution; micro-jumps induce fatigue duration limitations before threshold is reached.
5. Sampling: Last 30 seconds of the stage. Use a consistent site (earlobe or finger) and wipe the first drop to avoid sweat contamination.
6. Analysis: Plot Lactate vs. Power/Speed. Fit a 3rd-order polynomial. Calculate the point on the curve yielding the maximal perpendicular distance from the line connecting the first point (or point preceding first rise) and the final point.
Case Study:
Subject: Elite Cyclist (VO2max 78 ml/kg/min).
Scenario: Standard incremental test (30W steps, 4 min stages).
Data
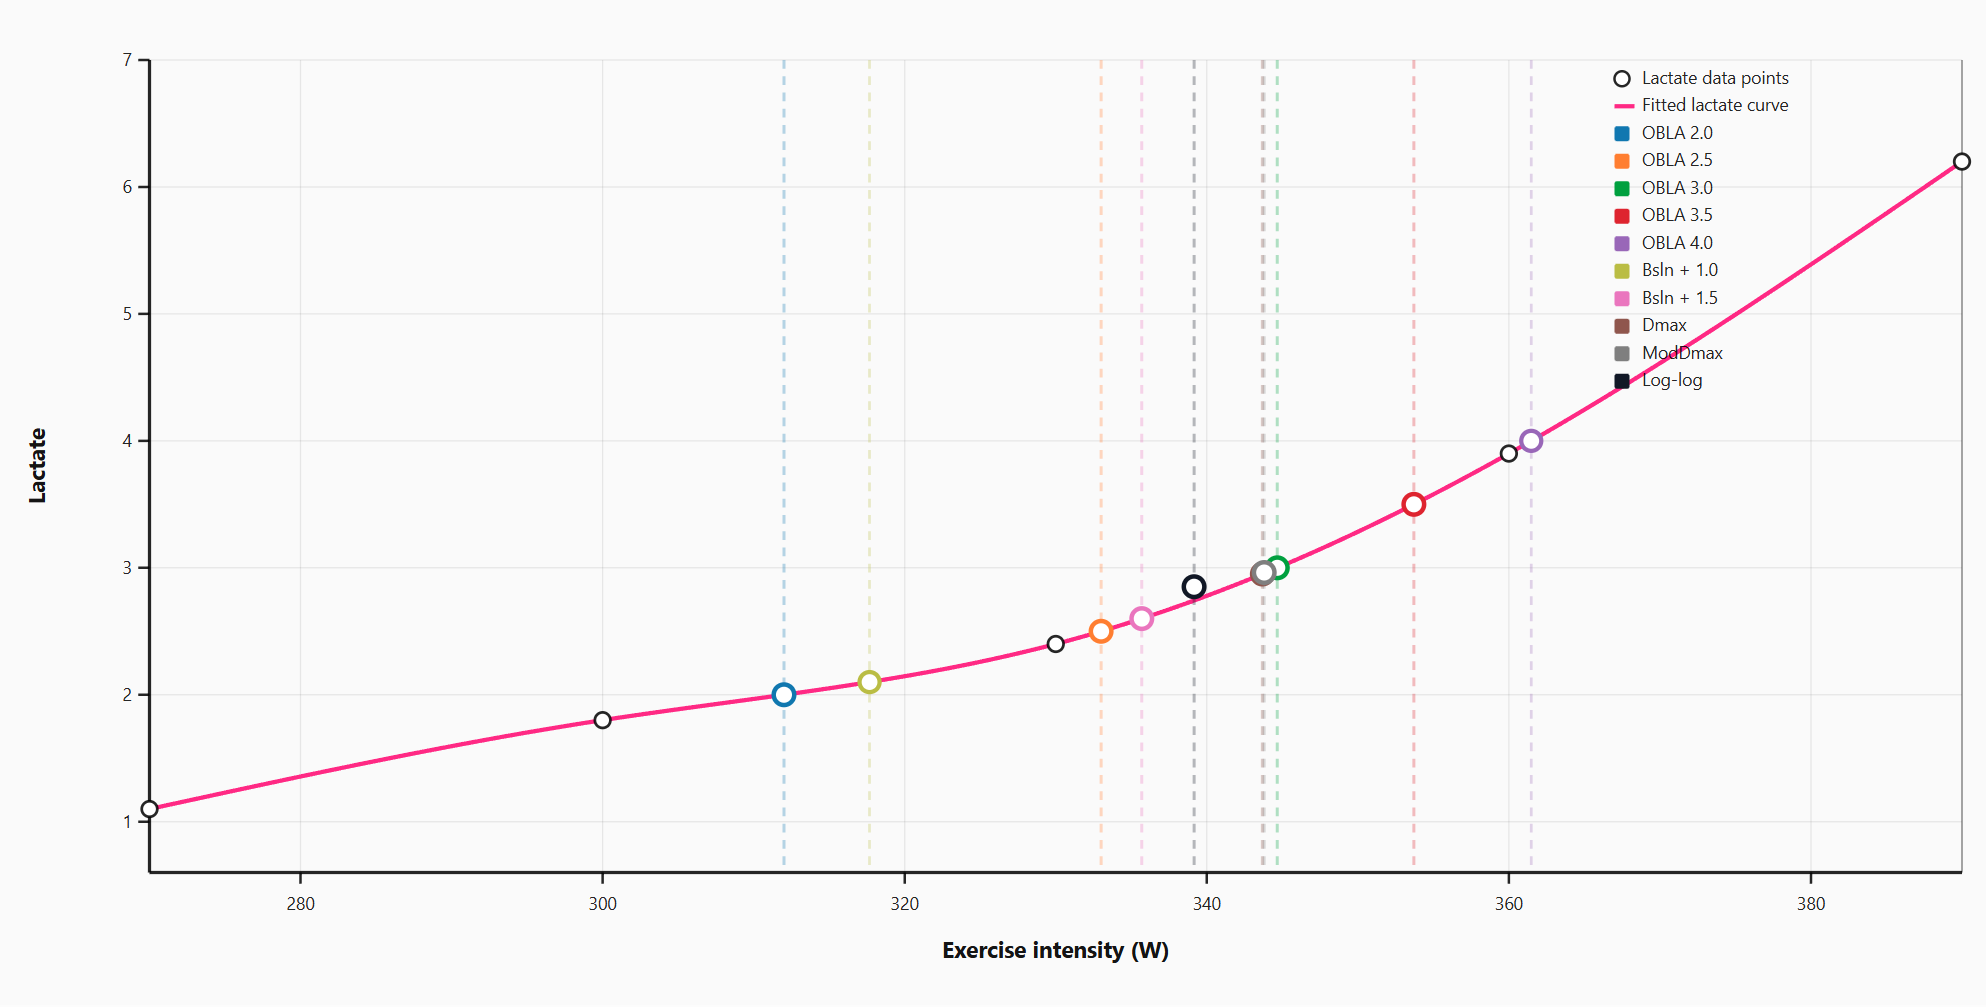
• Baseline: 1.1 mmol/L.
• 300W: 1.8 mmol/L.
• 330W: 2.4 mmol/L.
• 360W: 3.9 mmol/L.
• 390W: 6.2 mmol/L.
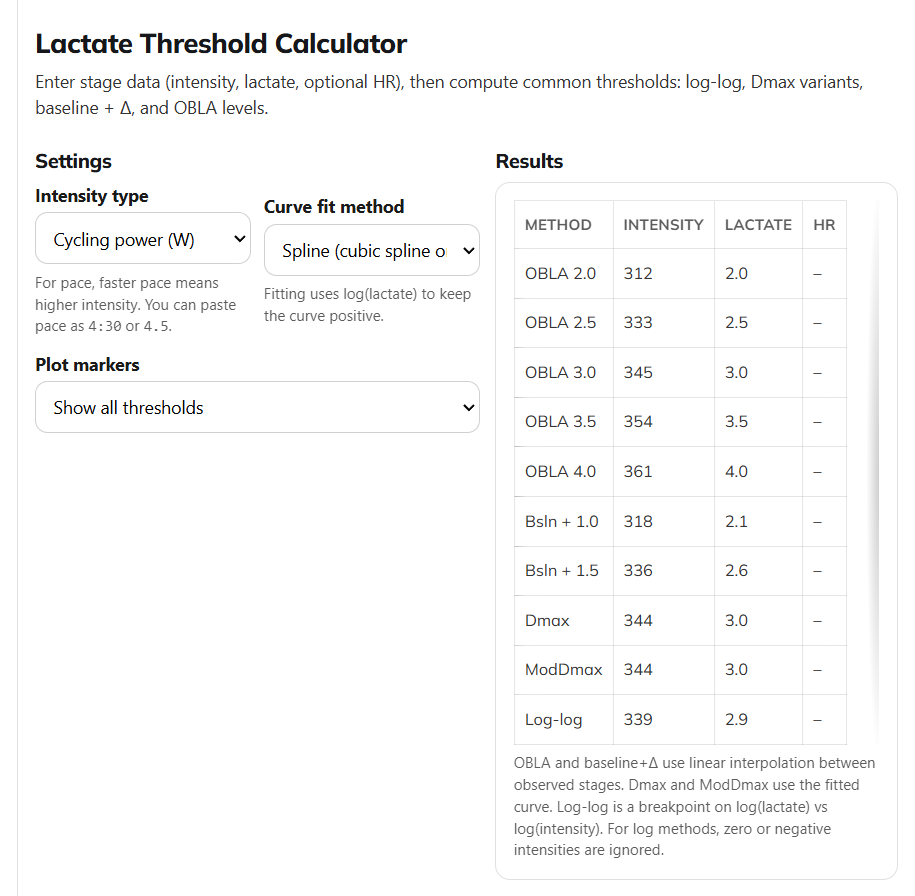
Analysis with The Scientist`s Notebook Lactate Threshold analyzer
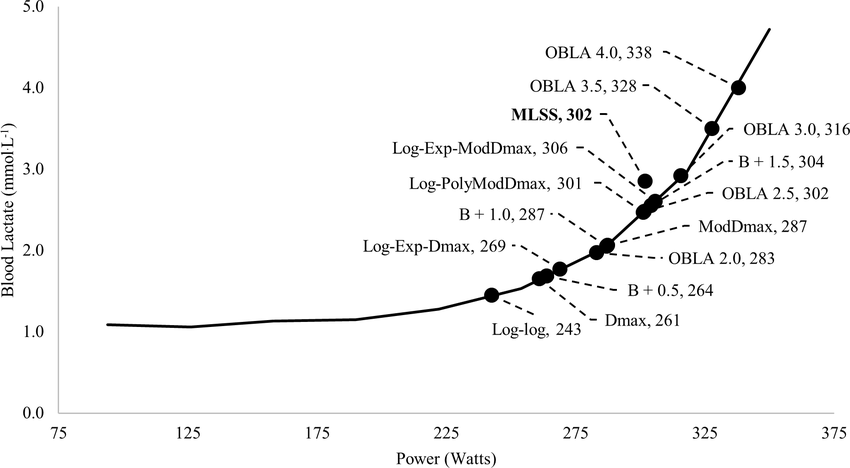
Analysis Divergence:
• Method A (Fixed 4 mmol/L): Interpolates threshold at ~361 Watts.
• Method B (Modified Dmax): Identifies the inflection point of the curve relative to the baseline rise. Calculated threshold: 344 Watts.
Outcome: The 4 mmol/L method overestimated the threshold due to the athlete's specific curve kinetics and the lag time inherent in 4-minute stages. Prescribing intervals at 361W (Method A) would likely place the athlete in the severe intensity domain, leading to rapid accumulation of fatigue and non-functional overreaching. The Modified Dmax value (344W) aligns closer to the sustainable physiological MLSS.
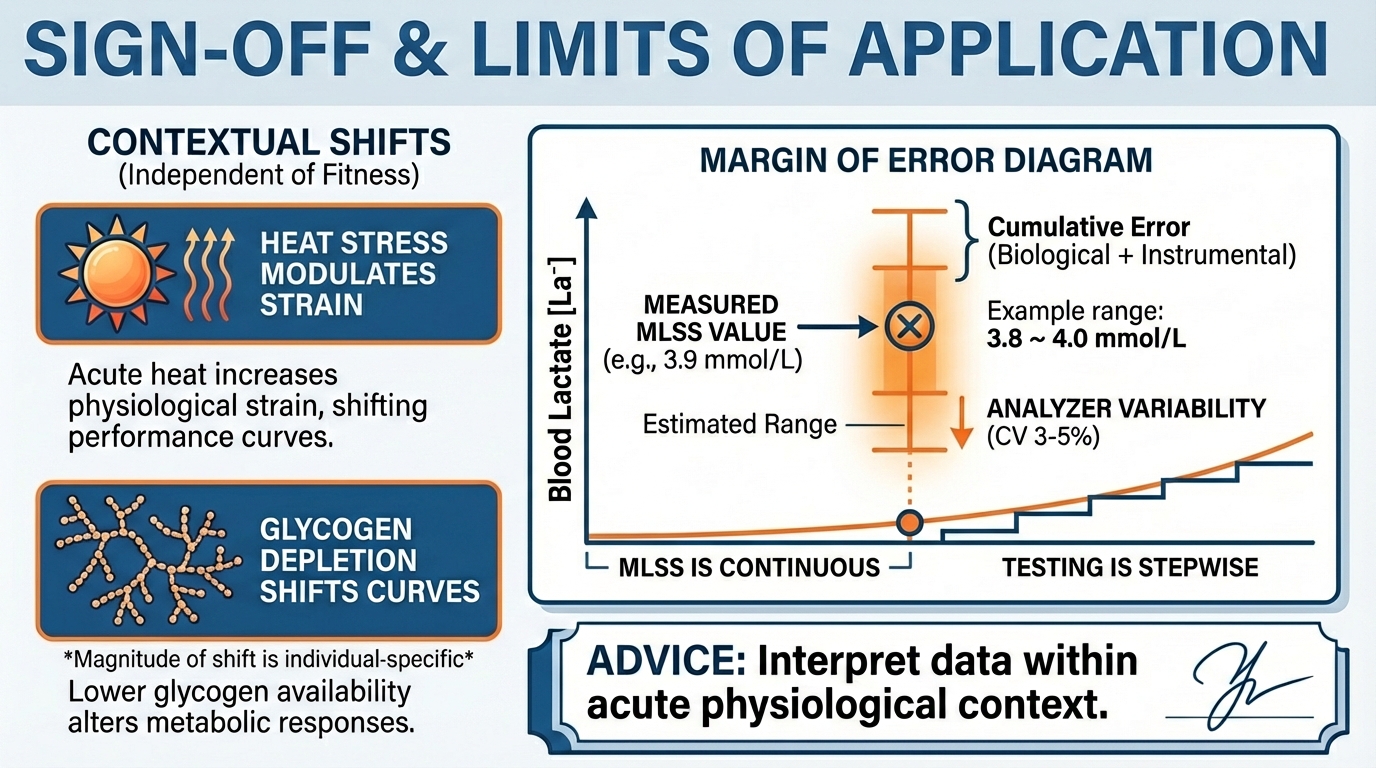
Limits of Application:
The application of these methods is bounded by several methodological constraints. First, the 'Gold Standard' MLSS is itself a construct limited by discrete power increments; the true physiological steady state is continuous.
Second, portable lactate analyzers possess a coefficient of variation (CV) of 3-5%; a reading of 3.8 mmol/L is often statistically indistinguishable from 4.0 mmol/L, necessitating the use of training zones rather than precise wattage targets.
Finally, environmental factors (heat stress) can increase lactate appearance, while nutritional status (low carbohydrate availability) can suppress lactate levels, shifting the curve independently of aerobic fitness changes. Data must always be interpreted within the context of the athlete's acute physiological state.
Best regards,
Dr. Thomas Mortelmans
PS: Curious to know what you liked today.Tap here for a 45-second anonymous survey. I read every single note!

References:
2. Improved detection of lactate threshold during exercise using a log-log transformation - PubMed |
3. Lactate threshold concepts: how valid are they? - PubMed |
4. Lactate Threshold vs OBLA: Training Insights |
5. Does the anaerobic threshold really occur at 4 mmol/l blood lactate? — INSCYD
6. Standardization of the Dmax method for calculating the second lactate threshold - PubMed |
7. The maximal metabolic steady state: redefining the ‘gold standard’ - PMC |
9. Lactate Threshold Interpretation Methods |
10. The Maximal Metabolic Steady State: Redefining the Gold Standard |
11. Comparison of objective methods for determining ventilatory threshold - PubMed |
12. The First Lactate Threshold Is a Limit for Heavy Occupational Work - PMC |
Found this useful?
Get articles like this and free training calculators in your inbox every week.
Recommended reads
If this was useful, these are the other research-driven newsletters I actually read.

Member discussion