Entry #026: Why Your FTP Might Be Wrong: mFTP, CP, and Modeled Thresholds
Most cyclists do a 20-minute test, multiply by 0.95, and call that their FTP. It's clean. It's repeatable. It's the number every training plan asks for.
It's also, for a lot of riders, wrong.
Not by an embarrassing amount. Most field tests land within ±5% of the truth, which sounds tight on paper, but the gap is enough to misroute six weeks of training because everything downstream gets calibrated against the same anchor.
If your FTP is off by 10 watts, every interval session you do is pointing at the wrong target. Sweet-spot becomes tempo. Threshold becomes sub-threshold. Over-unders become tedious-unders. Six weeks later you wonder why nothing feels harder.
This week`s entry is about how to tell when the field-test number isn't the real one, and what to do about it - And how Gradescale solves that issue, right in your browser.
What FTP is supposed to be
The textbook definition: the highest power you can hold for an hour at race-pace, fully fresh, on a flat course, with appropriate fuelling. FTP stands for Functional Threshold Power, and it's a stand-in for that 60-minute number because nobody wants to do a flat-out hour every six weeks.
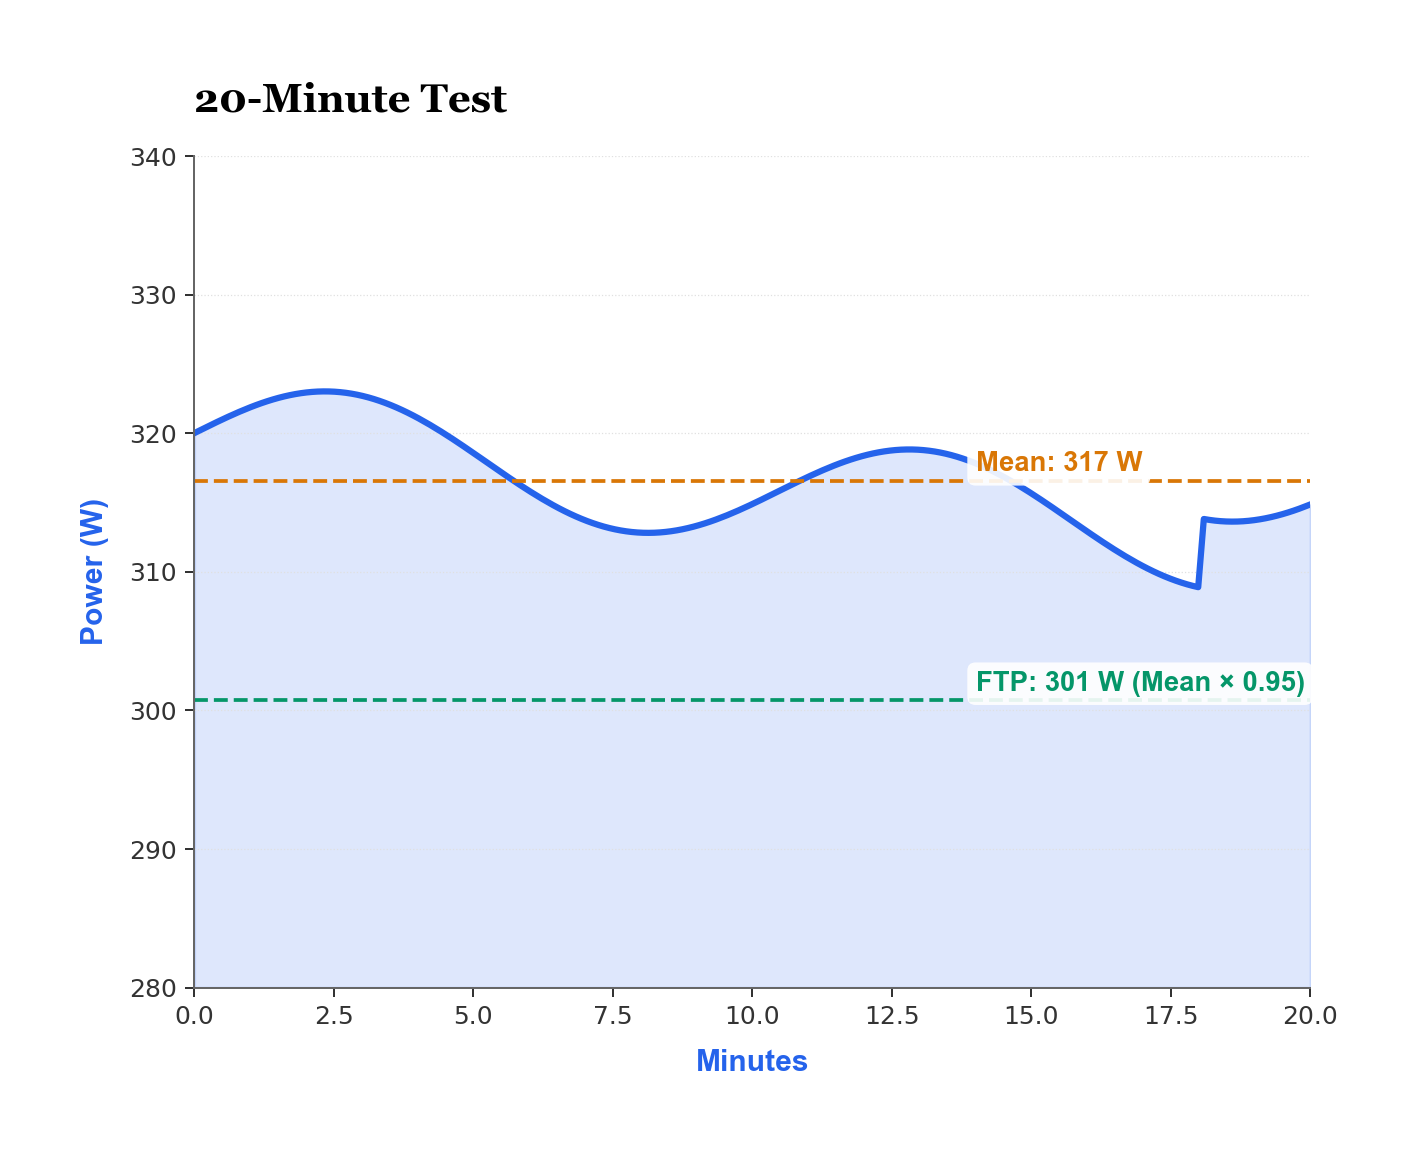
The 95% × 20-min protocol exists as a short-cut. The 20-minute average is roughly 5% above the true 1-hour number because the test still includes a small contribution from your anaerobic store, even when paced cleanly.
The trick is that the 5% factor isn't constant across athletes. Anaerobically gifted riders often need 90%, since their 20-min effort leans heavily on W' that they can't sustain for an hour. Diesel-engine riders sometimes need 96 to 97% because their 20-min effort looks almost identical to their 60-min effort.
One factor for everyone is a population approximation, not a personal truth.
The signs your FTP is too high
Three signals worth watching for:
1. You can't finish a sweet-spot session. A real sweet-spot set at 88 to 94% of true FTP should be hard but doable to the end. If you're blowing up halfway through 4×20 min at sweet-spot, either your nutrition or your FTP is wrong, and FTP is the easier suspect to verify.
2. Your 1-hour all-out time-trial is below your stated FTP. Your real FTP, by definition, is what you can hold for an hour. If you do a clean 60-minute TT and average 240 W when your stated FTP is 250 W, your stated FTP is too high.
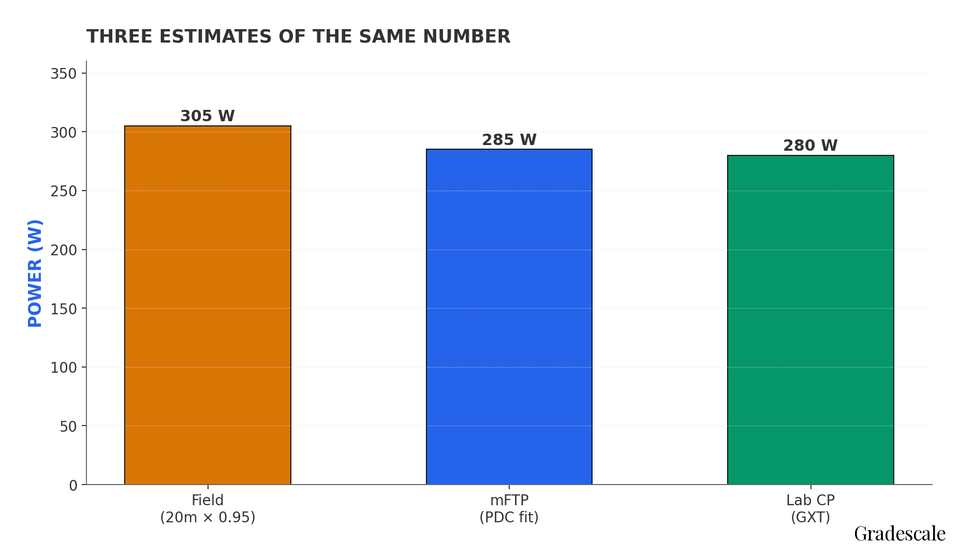
3. Your CP modeled estimate is consistently lower than your field-test FTP. Modeled CP is derived from your full power-duration curve. If it disagrees with your FTP by more than 8 to 10 W, the CP model is usually closer to reality.
The signs your FTP is too low
Two flags:
1. You can hold "threshold" power for 75 to 90 minutes in races. Real threshold caps out around 60 minutes for most riders. If you're routinely sitting 5 to 10 W above your stated FTP for an hour and a half without imploding, your threshold is higher than you think.
2. You feel under-prescribed in interval sessions. A 5×8 min interval set at 105% of true FTP should be uncomfortable. If it feels like a tempo grind, your FTP estimate is conservative.
The "too low" case is more common with athletes returning from breaks (their fitness has come back faster than their last test captured) and with riders who pace 20-minute tests too cautiously.
The CP model alternative
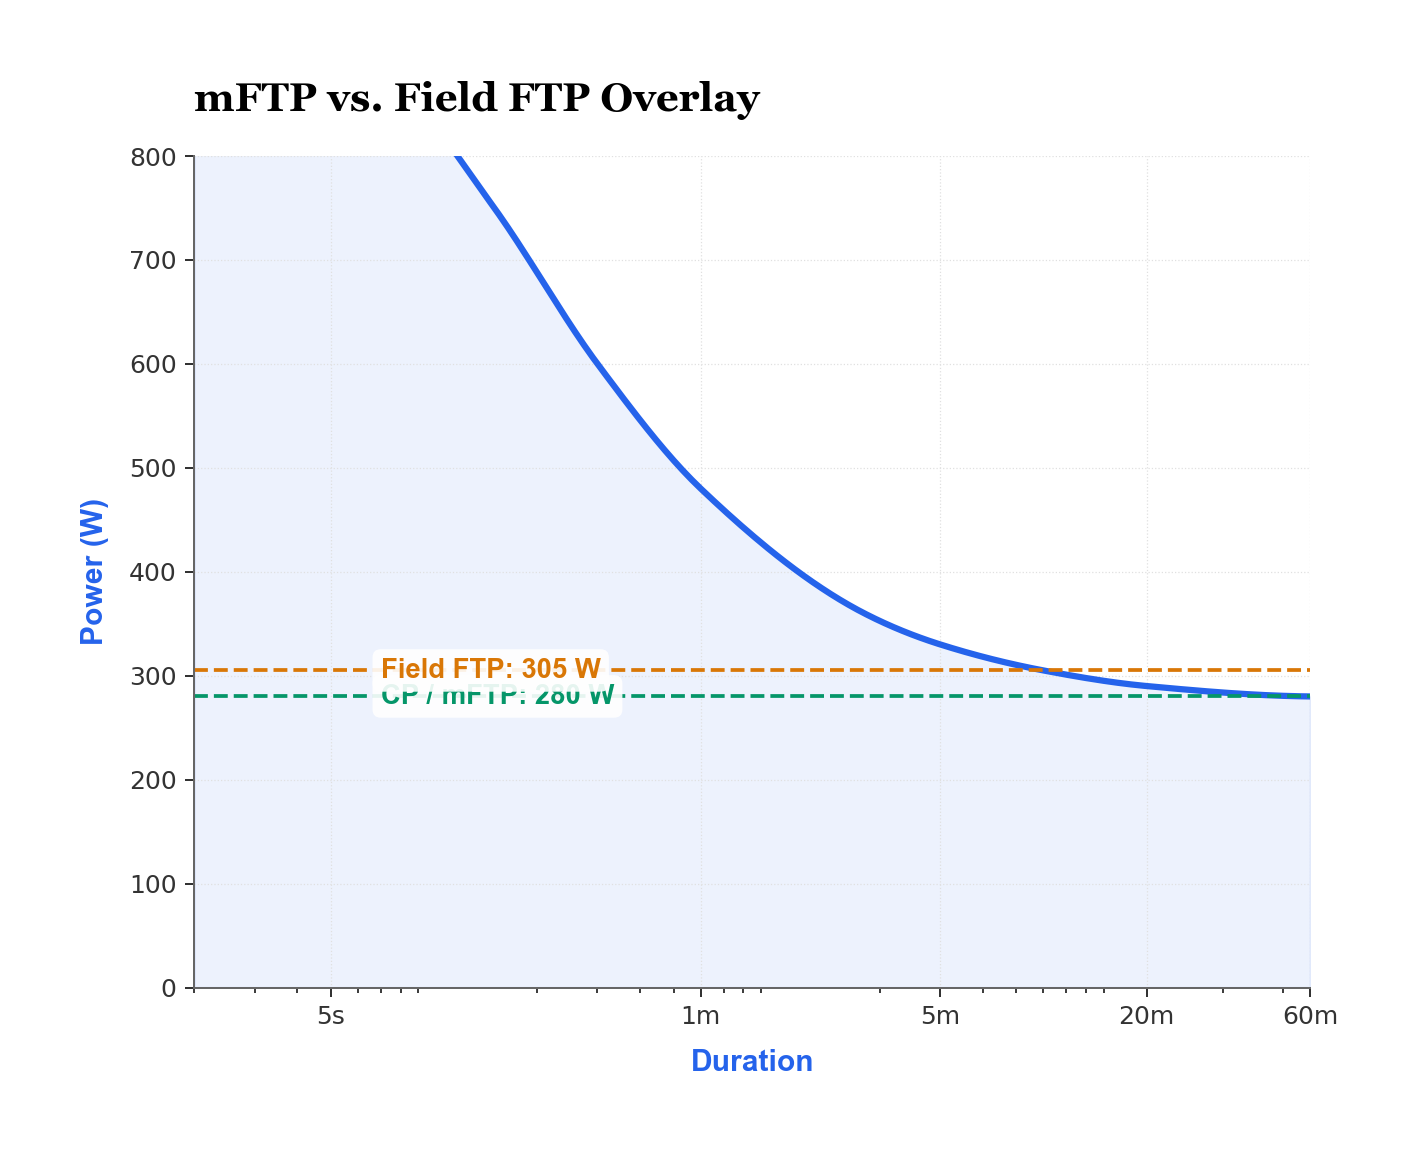
The Power-Duration Curve approach is different from a single test. Instead of one all-out effort, your full PDC is fit to a model that solves for two parameters, Critical Power (CP) and W', using your best efforts at multiple durations.
CP, in practice, is your true FTP-equivalent.
The advantage:
- It updates continuously as you train. New best efforts at any duration shift the curve, so a great 5-minute effort and a great 90-minute effort both inform the estimate.
- It doesn't require a dedicated test. Your races and hard workouts are the data.
- It separates aerobic threshold from anaerobic capacity (W'), so you can see which one moved when fitness changes.
The disadvantage:
- It needs at least 90 days of varied-intensity riding to converge. Riders who only do steady tempo will get a noisy CP estimate.
- It's only as good as your hardest efforts. If you've never ridden truly all-out at 5 minutes and at 60 minutes, the model has to interpolate.
When CP and FTP disagree, who's right?
Mostly CP. But not always.
The CP model is closer to ground truth when you have the right data, meaning at minimum 3 to 4 distinct durations of hard efforts in the fitting window. Without those, CP is curve-fitting noise.
Field-test FTP wins when:
- The athlete only rides steady (CP fit will be unreliable).
- It's been less than 60 days of riding (CP needs time).
- The athlete has done a long, well-paced 60-minute TT recently.
That's the direct measurement of FTP and beats any model.
The honest answer is to look at both numbers and reconcile. If they're within 5 W, either one is fine. If they disagree by 10+ W, dig into why.
Gradescale: Your physiology, decoded. Join the waitlist now.

eFTP and mFTP, same thing under different names
You'll see "eFTP" (exponential FTP) and "mFTP" (modeled FTP) in different platforms. Both are CP under different naming. The underlying math: fit a 2-parameter curve to your best efforts and solve for the asymptote.
Different platforms use slightly different fit windows (42 days, 90 days, 180 days) and slightly different model equations (2-parameter vs 3-parameter), which is why the same rider's eFTP on platform A doesn't match mFTP on platform B. They're all trying to estimate the same thing.
The ramp test trap
The ramp test is a great fitness test. As an FTP estimator, it has a known bias: it over-rewards VO2max-dominant riders, and the mechanism is worth tracing because it explains why two riders with identical FTPs can post wildly different ramp results without either of them being wrong.
Here's the why. The 1-minute peak power on a ramp test (MAP) reflects your maximal aerobic capacity, but it also pulls heavily on W' to finish the final stage, so what you see at the top is a blend of sustainable aerobic ceiling and disposable anaerobic battery.
The standard 75% × MAP = FTP factor assumes a typical W'/CP ratio across the population. Riders with above-average W' get higher MAP relative to their CP, and the ramp test prescribes them a too-high FTP.
The opposite happens to diesel-engine types: they ramp lower than their true FTP would predict because they have less anaerobic gas to finish the upper stages.
If you've ramped at 380 W and your subsequent threshold sessions at 285 W feel impossible, your real FTP might be 265 to 270, not 285.
Use the ramp test to track changes in fitness over time. Don't use it to set your absolute FTP. A 20-min test or CP is better for the absolute number.
How often to retest
The honest cadence:
- Every 6 weeks during a build phase. Fitness changes meaningfully on this timescale; a stale FTP under-prescribes work.
- At the start and end of each season. Compare seasons.
- After a long break (3+ weeks off). Detraining is real; pretending nothing changed sets up bad sessions.
- Never during a hard race block. Testing while accumulated fatigue is high produces a low estimate that doesn't reflect your actual fitness, and you'd just spend a week recalibrating zones unnecessarily.
If you can do a real 60-minute time trial once or twice a year, do that instead of a 20-minute test. It's the gold standard.
Practical reconciliation
When field-test FTP and modeled CP disagree, here's the procedure that resolves it most reliably:
1. Look at the spread. If they're within 5 W (≈2%), pick either; the difference doesn't matter for training.
2. If 5 to 10 W apart, default to the lower number. It costs you almost nothing in training adaptation. Sweet-spot at 245 W instead of 252 W still produces sweet-spot adaptations, and it removes the risk of over-prescribing every session.
3. If > 10 W apart, do the diagnostic work. Either the field test is bad (poorly paced, fresh-not-fresh, wrong protocol) or the CP fit is bad (insufficient or stale data). Identify which and fix it.
Treat FTP as a range, not a point.
A given session might use the conservative end (e.g., over-unders where you can't afford to blow up at the second under). Another might use the aggressive end (a planned over-reach week where the target is to push the system).
This is closer to how thresholds actually work in physiology anyway. The lactate-threshold "boundary" is a 10 to 15 W band, not a single watt. Acting like it's a hard wall sets you up for disappointment when an interval session at exactly 100% of FTP turns out to be slightly too easy or slightly too hard depending on the day.
The takeaway
Your FTP is an estimate. The 95% × 20-min protocol is good but not exact. The CP model is good but data-hungry. Neither is The Truth. The truth is the curve, and your job is to read both estimates as different angles on it.
A few minutes a season verifying that your FTP and CP agree is the cheapest training-quality investment you can make.
Gradescale renders both your field-test FTP and your CP-modeled threshold side by side, with a dispersion warning if they disagree by more than 8 W. The premium tier surfaces the disagreement automatically as a calibration nudge.
References
- Monod & Scherrer 1965, The Work Capacity of a Synergic Muscular Group
- Moritani et al. 1981, Critical Power as a Measure of Physical Work Capacity and Anaerobic Threshold
- Morton 1996, A 3-Parameter Critical Power Model
- Jones et al. 2010, Critical Power: Implications for Determination of VO2max and Exercise Tolerance
- Vanhatalo et al. 2007, Determination of Critical Power Using a 3-min All-out Cycling Test
- Poole et al. 2016, Critical Power: An Important Fatigue Threshold in Exercise Physiology
- Burnley & Jones 2018, Power-Duration Relationship: Physiology, Fatigue and the Limits of Human Performance
- Jones et al. 2019, The Maximal Metabolic Steady State: Redefining the “Gold Standard”
- Karsten et al. 2020, Relationship Between the Critical Power Test and a 20-min Functional Threshold Power Test in Cycling
- Borszcz et al. 2018, Functional Threshold Power in Cyclists: Validity of the Concept and Physiological Responses
- Borszcz et al. 2019, Is the Functional Threshold Power Interchangeable With the Maximal Lactate Steady State in Trained Cyclists?
- Inglis et al. 2020, Maximal Lactate Steady State Versus the 20-Minute Functional Threshold Power Test in Well-Trained Individuals: “Watts” the Big Deal?
- Lillo-Beviá et al. 2022, Is the Functional Threshold Power a Valid Metric to Estimate the Maximal Lactate Steady State in Cyclists?
- Sitko et al. 2022, Time to Exhaustion at Estimated Functional Threshold Power in Road Cyclists of Different Performance Levels
- Caen et al. 2024, Critical Power and Maximal Lactate Steady State in Cycling: “Watts” the Difference?
Disclaimer
The information provided in this newsletter is for educational purposes only and does not constitute medical advice. Exercise physiology is highly individual; what works for elite populations may not apply to everyone. Always consult with a physician before making significant changes to your training, nutrition, or supplementation protocols. The Scientist's Notebook and ESQ Coaching accept no liability for injuries or health issues arising from the application of these concepts.
Found this useful?
Get articles like this and free training calculators in your inbox every week.
Recommended reads
If this was useful, these are the other research-driven newsletters I actually read.
Member discussion