HRV Baseline Calculator
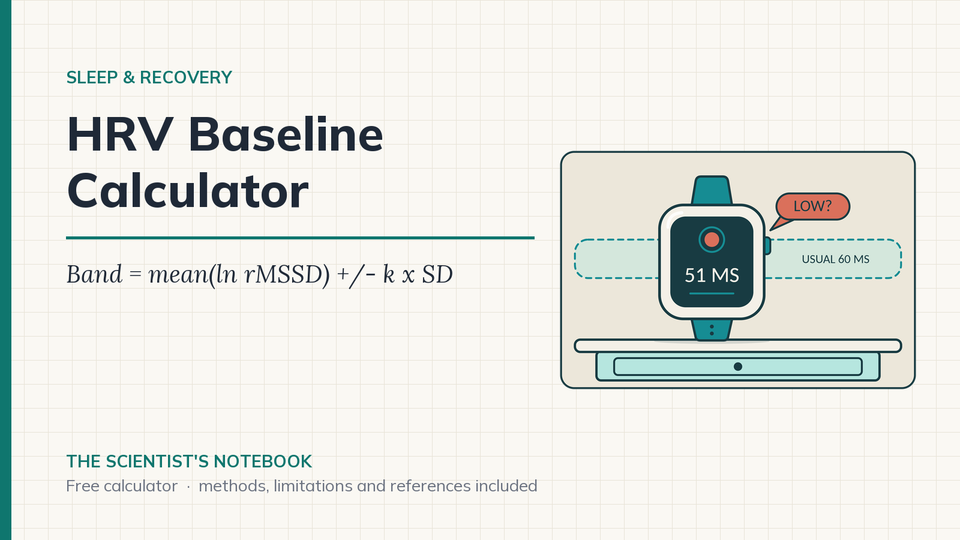
One morning's HRV reading is noisy, so the athlete-monitoring papers compare a rolling average with your own normal range instead. This calculator does that arithmetic and tells you where the recent average sits, without telling you what to do.
In short: The HRV baseline calculator log-transforms your morning rMSSD and compares the mean of your last 7 days with your own baseline mean plus or minus a smallest worthwhile change of 0.5 or 1 baseline standard deviations. It tells you whether the recent mean sits above, within or below that band. It describes your numbers and does not prescribe training.
How does the HRV baseline comparison work?
Everything runs on rMSSD, the beat-to-beat HRV measure most wearables and chest-strap apps report, in milliseconds. It is a short-term time-domain index defined in the 1996 Task Force standards. It is log-transformed first because raw rMSSD is skewed.
- x = ln(rMSSD in ms), for each morning. Readings from 1 to 300 ms are accepted
- μ and σ = mean and sample standard deviation of x over your baseline days (at least 14)
- m = mean of x over the last 7 days (at least 3 readings)
- SWC = k × σ, the smallest worthwhile change. k is 0.5 or 1. Because σ is a standard deviation on the log scale, it is close to the day-to-day coefficient of variation (CV) of your raw rMSSD, so the band spans roughly k times that CV either side of your baseline
- Band = μ − SWC to μ + SWC. The recent mean is above the band if m > μ + SWC, below it if m < μ − SWC, and within it otherwise
- z = (m − μ) / σ. Milliseconds shown are back-transformed with exp()
Worked example. Baseline of 14 mornings: 62, 58, 65, 61, 55, 63, 60, 57, 66, 59, 64, 56, 62, 60 ms. Last 7 days: 55, 57, 52, 54, 50, 53, 51 ms.
- Baseline: μ = 4.1024 (60.49 ms), σ = 0.0554. The raw readings have a day-to-day CV (SD / mean) of 5.52%, close to σ
- With k = 0.5: SWC = 0.0277, band = 4.0747 to 4.1301, which is 58.83 to 62.19 ms, from 2.7% below to 2.8% above the baseline
- Recent: m = 3.9721 (53.10 ms), which is 12.2% below the baseline mean, z = −2.35
- m is below 4.0747, so the recent mean sits below your usual band. With k = 1 the band widens to 57.22 to 63.93 ms and the result is the same
- The baseline here is 14 days, so the tool also notes that the band is provisional
- The tool also shows the CV of the ln values (σ / μ = 1.35% here), the measure Plews 2012 tracked. It is a different number from the raw CV and it is not the band width
How do I use my HRV band?
- Review weekly, not daily. Plews and colleagues recommend a rolling average of ln rMSSD instead of single values, and found that a minimum of 3 valid readings per week was enough to track training in trained triathletes. Read the direction of the 7-day mean across several weeks.
- Ask what else changed. A mean below your band can sit next to a hard training block, a short week of sleep, travel, alcohol or a cold. Write down the context before deciding anything. The training load calculator shows the load side and the heart-rate recovery calculator adds another autonomic signal.
- Know what the trials did. Two small trials scheduled hard sessions by HRV. In 26 healthy men over 4 weeks (9 HRV-guided, 8 on a predefined plan, 9 controls), the HRV-guided group improved maximal running velocity more than the predefined group (Kiviniemi 2007). In 40 recreational runners over 8 weeks, the guided group did fewer moderate and hard sessions, improved 3000 m performance by 2.1% against 1.1%, and the between-group effect size was 0.42, small (Vesterinen 2016). Those are study protocols, not a prescription for you.
What are the limits of an HRV band?
- The band width is a convention. Smallest worthwhile change for heart-rate measures has been set at 0.5 or 1 times the coefficient of variation, and Buchheit notes there is no evidence yet that any fraction of the CV is the right one (Buchheit 2014).
- The 14-day baseline floor is mine, not a published minimum. A short baseline gives a rough standard deviation and a provisional band.
- In elite athletes both rises and falls in HRV have been linked to negative adaptation, and HRV can fall despite a falling resting heart rate, a pattern called saturation (Plews 2013). A reading above your band is not automatically a good sign.
- The supporting trials are small, short and in healthy runners. Plews 2012, which tracked the 7-day mean and its variation, was a case study of two elite triathletes.
- Device, position, recording length and time of day all change rMSSD. Keep them the same every morning.
- This is a comparison with your own history, not a medical test, and a value inside or outside the band says nothing about your heart. If you have palpitations, dizziness, chest discomfort or fainting, stop and talk to a clinician whatever the number says.
⚠️ HEALTH & TRAINING GUIDANCE
Individual results vary significantly. HRV compares you with your own history and is not a health check. Consult a sports medicine professional before making changes based on these estimates, and seek medical help for palpitations, dizziness, chest discomfort or fainting.
ℹ️ IMPORTANT DISCLAIMER
This calculator is for educational purposes only and does NOT constitute medical advice. Consult qualified professionals before making changes. Individual physiology varies. You assume all risk. Must be 18+.
Frequently asked questions
How is the HRV band calculated?
Each morning's rMSSD is converted to its natural log. The band is the baseline mean of those values plus or minus k times their standard deviation, with k = 0.5 or 1. On the log scale that standard deviation is close to the day-to-day CV of your raw readings: in the worked example σ = 0.0554 and the raw CV is 5.52%, so the 0.5 band runs from 58.83 to 62.19 ms.
How many HRV readings do I need?
This tool asks for at least 14 baseline days, which is my floor and not a published minimum, and at least 3 readings from the last 7 days. Plews and colleagues found that a minimum of 3 valid readings per week was enough to track training in trained triathletes (Plews 2014). A short baseline gives a rough standard deviation, so the band is provisional.
Is a higher HRV always better?
No. In elite athletes both rises and falls in HRV have been linked to negative adaptation, and HRV can fall despite a falling resting heart rate, a pattern called saturation (Plews 2013). A recent mean above your band is a position, not a good sign on its own. Read it next to resting heart rate, sleep and training load.
Should I train hard only when my HRV is inside the band?
That was the protocol of a trial, not a rule. In 40 recreational runners over 8 weeks, the HRV-guided group did fewer moderate and hard sessions and improved 3000 m performance by 2.1% against 1.1%, a small between-group effect size of 0.42 (Vesterinen 2016). In 26 healthy men over 4 weeks, HRV-guided training improved maximal running velocity more than a predefined plan (Kiviniemi 2007).
Related calculators
- Caffeine Half-Life and Bedtime Cutoff Calculator
- Sauna Heat-Adaptation Planner
- Sleep Cycle Calculator: Bedtime and Wake-Up Times
- Sleep Debt Calculator: Need vs Actual Sleep
- All calculators on The Scientist's Notebook
References
- Plews DJ et al. · 2013 · Sports Medicine · PMID 23852425 · doi
- Plews DJ et al. · 2014 · International Journal of Sports Physiology and Performance · PMID 24334285 · doi
- Buchheit M. · 2014 · Frontiers in Physiology · PMID 24578692 · doi
- Kiviniemi AM et al. · 2007 · European Journal of Applied Physiology · PMID 17849143 · doi
- Vesterinen V et al. · 2016 · Medicine & Science in Sports & Exercise · PMID 26909534 · doi
- Plews DJ et al. · 2012 · European Journal of Applied Physiology · PMID 22367011 · doi
- Task Force of the ESC and NASPE · 1996 · Circulation · PMID 8598068 · doi