Lean Body Mass Calculator
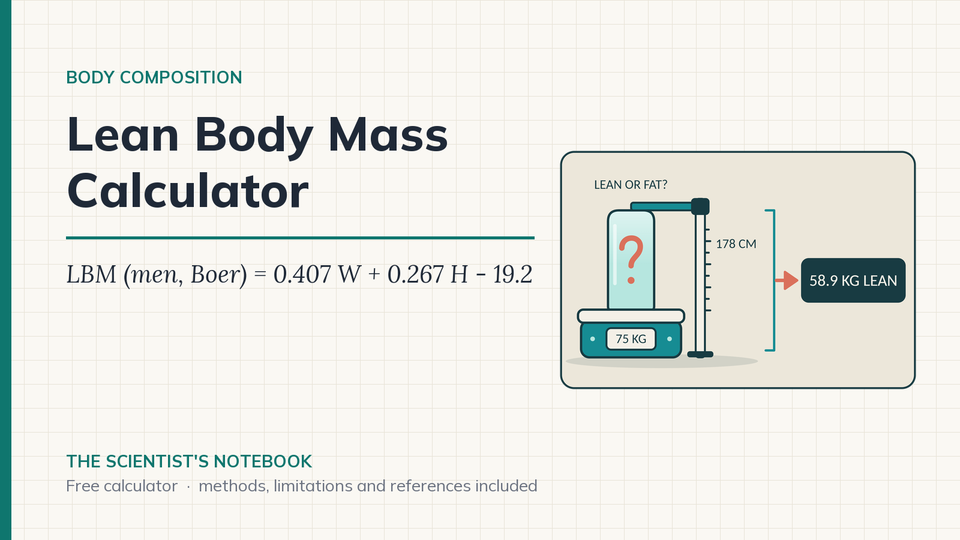
Lean body mass is everything that is not fat: muscle, bone, organs and water. This tool estimates it three ways from height and body mass (Boer, James, Hume), or works it out directly if you already have a body fat percentage from a measurement.
In short: Lean body mass is body mass minus fat: muscle, bone, organs and water. This calculator runs the Boer, James and Hume equations, which estimate it from sex, height and body mass. Boer for men is 0.407 W + 0.267 H - 19.2, so a 75 kg man at 178 cm gets 58.9 kg. With a measured body fat percentage, lean mass is W x (1 - BF%/100).
How is lean body mass calculated?
Let W be body mass in kg and H be height in cm.
- Boer (1984): men LBM = 0.407 W + 0.267 H − 19.2. Women LBM = 0.252 W + 0.473 H − 48.3.
- James (1976): men LBM = 1.10 W − 128 (W/H)2. Women LBM = 1.07 W − 148 (W/H)2.
- Hume (1966): men LBM = 0.32810 W + 0.33929 H − 29.5336. Women LBM = 0.29569 W + 0.41813 H − 43.2933.
- From a known body fat: LBM = W × (1 − BF%/100). Fat mass = W − LBM.
- Implied body fat from an equation: (W − LBM) / W × 100.
The James equation has a built-in peak. It reaches its maximum at W = 1.10 H2/256 for men and 1.07 H2/296 for women, and beyond that body mass it predicts less lean mass for a heavier person. The tool flags it past that point and leaves it out of the mean. An equation whose implied body fat falls under 2 percent or over 70 percent (including a lean mass at or above body mass) is flagged the same way. Without a measured body fat the Boer value is the headline, so if Boer is the one flagged the tool shows no number and asks you to check the values or enter a measured body fat.
Worked example. A man, 75 kg, 178 cm. Boer: 0.407 × 75 + 0.267 × 178 − 19.2 = 30.53 + 47.53 − 19.2 = 58.9 kg, which implies 21.5 percent body fat. James: 1.10 × 75 − 128 × (75/178)2 = 82.5 − 22.72 = 59.8 kg. Hume: 24.61 + 60.39 − 29.53 = 55.5 kg. The mean of the three is 58.0 kg. If a DXA scan gave him 15 percent fat instead, lean mass would be 75 × 0.85 = 63.8 kg, 4.9 kg above the Boer figure.
How should I use the result?
- Prefer a measured body fat when you have one. Type it in and the tool computes lean mass directly. Get the figure from DXA, a skinfold assessment or the body fat calculator, and keep the method the same each time.
- Feed it into fat-free mass index. Lean mass divided by height squared gives the fat-free mass index, which is more informative for a muscular athlete than BMI.
- Use it as an input for energy estimates. Resting energy equations that take fat-free mass as an input need this number. The BMR calculator shows the options.
What are the limits of lean body mass equations?
- The equations cannot see body composition change. They are functions of body mass and height. Gain 1 kg and Boer adds 0.407 kg of lean mass for a man, whether you gained muscle or fat. Never use them to judge whether a diet or a training block preserved muscle.
- The equations disagree. In the worked example the three span 55.5 to 59.8 kg, 4.3 kg. Treat any single value as good to a few kilograms at best.
- Hume 1966 fitted lean mass from total body water (antipyrine space) in 29 men and 27 women. The multiple correlation was 0.96 in men and 0.83 in women, so the fit is weaker for women (Hume 1966). Boer 1984 proposed estimated lean mass as a yardstick for normalising blood and extracellular fluid volumes, which he measured in 66 and 54 healthy adults. The paper is about fluid volumes, not muscle (Boer 1984).
- Janmahasatian and colleagues reported that current lean-weight prediction methods are inconsistent at extremes of size. Their own DXA-referenced model, built and tested on 373 patients in two groups, had an RMSE of about 3.3 kg (6 percent of the mean) in the build group and 4.4 kg (7 percent) in the test group (Janmahasatian 2005).
- Lean body mass is not muscle mass. It includes bone, organs, connective tissue and water.
- Before anything is calculated, body mass (30 to 300 kg), height (120 to 230 cm) and any body fat you enter (2 to 70 percent) are checked against input ranges shared by every TSN calculator. These are data-entry checks set by TSN, not physiological norms. Values near the edges still give a result, with a note above it.
- The Hume equations rest on 56 adults measured in the 1960s with a body-water method, not DXA. Neither the Hume nor the Boer paper reports data from trained athletes.
⚠️ HEALTH & TRAINING GUIDANCE
Individual results vary significantly. These are population equations and cannot track changes in your muscle. Consult a sports medicine professional or registered dietitian before making changes to your eating or training based on these estimates.
ℹ️ IMPORTANT DISCLAIMER
This calculator is for educational purposes only and does NOT constitute medical advice. Consult qualified professionals before making changes. Individual physiology varies. You assume all risk. Must be 18+.
Frequently asked questions
Which lean body mass equation should I trust?
None of them to better than a few kilograms. For a 75 kg man at 178 cm Boer gives 58.9 kg, James 59.8 kg and Hume 55.5 kg, a spread of 4.3 kg. The tool shows Boer as the headline plus the mean of the three. If you have a body fat percentage from DXA or skinfolds, enter it: lean mass from a measurement is more direct than any height-and-weight equation.
Can the equations show that I gained muscle?
No. They only know height and body mass. Gain 1 kg and Boer adds 0.407 kg of lean mass for a man, whether that kilogram was muscle or fat. To follow a change in body composition, track a measured body fat percentage with the same method each time and enter it here.
How accurate are lean body mass equations?
Hume 1966 fitted lean mass from total body water in 29 men and 27 women, with multiple correlations of 0.96 and 0.83. Janmahasatian 2005 reported that lean-weight methods are inconsistent at extremes of size, and their own DXA-referenced model had a root mean square error of about 4.4 kg (7 percent) in its test group. Treat any single value as good to a few kilograms at best.
Why are some equations flagged?
The James equation reaches a maximum at a body mass of 1.10 times height squared divided by 256 for men, and 1.07 times height squared divided by 296 for women. Beyond that it predicts less lean mass for a heavier person. An equation whose implied body fat falls under 2 percent or over 70 percent is flagged too. Flagged values stay in the table but are left out of the mean.
Why does the calculator sometimes show no number?
Body mass must be 30 to 300 kg, height 120 to 230 cm and any body fat you enter 2 to 70 percent. These are TSN data-entry checks, not physiological norms. Without a measured body fat the Boer equation is the headline, so when it implies body fat under 2 percent or over 70 percent, as for some very light and tall people, the tool asks you to check the values or enter a measured body fat.
Related calculators
- BMI Calculator
- Body Fat Calculator (US Navy Method)
- Body Roundness Index (BRI) Calculator
- Body Surface Area (BSA) Calculator
- All calculators on The Scientist's Notebook