Fat-Free Mass Index (FFMI) Calculator
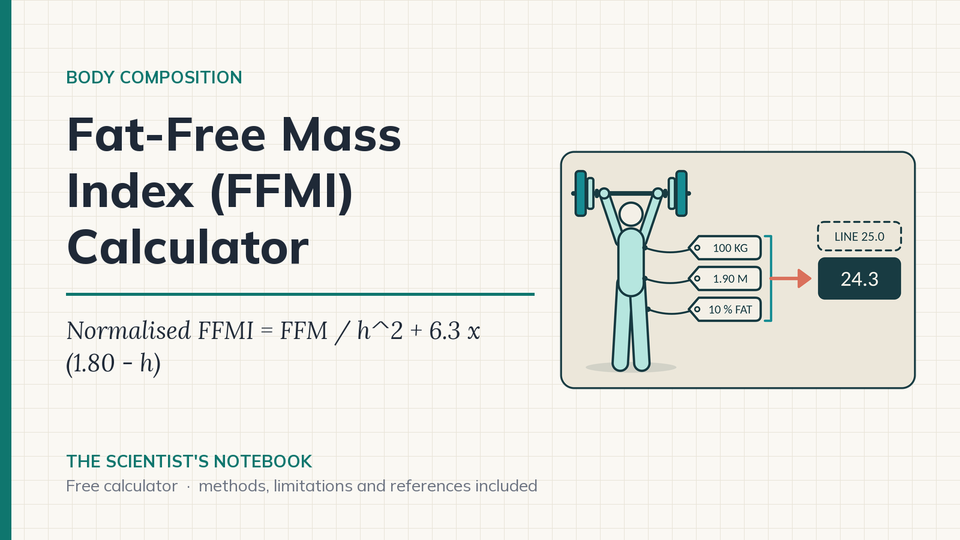
Fat-free mass index (FFMI) divides your fat-free mass by your height squared, so a tall athlete and a short athlete can be compared on lean tissue instead of scale weight. This version uses the Kouri 1995 height normalisation and falls back to a Boer lean-mass estimate when you have no body fat measurement.
In short: FFMI divides fat-free mass in kg by height in metres squared. This calculator then adds the Kouri 1995 correction, 6.3 x (1.80 - height in m), so athletes of different heights share one scale. A man of 100 kg and 190 cm with 10 % body fat has 90.0 kg fat-free mass, a raw FFMI of 24.93 and a normalised FFMI of 24.30 kg/m2.
How is FFMI calculated?
The calculator runs four steps, all in metric units.
- Fat-free mass. With a body fat value: FFM = body mass × (1 − body fat % / 100). Without one, the Boer 1984 equation estimates lean body mass from body mass and height: men 0.407 × mass + 0.267 × height − 19.2; women 0.252 × mass + 0.473 × height − 48.3 (mass in kg, height in cm).
- Raw FFMI. FFMI = FFM / height2, in kg/m2, with height in metres.
- Height normalisation. Normalised FFMI = FFMI + 6.3 × (1.80 − height in m). The coefficient is the one printed in Kouri 1995.
- Reference points. Your raw FFMI is shown next to the Schutz 2002 median for adults aged 18 to 34 (men 18.9, women 15.4 kg/m2). For men, the normalised value is also shown against the 25.0 ceiling that Kouri 1995 found in non-using male athletes.
Worked example. A man weighing 100 kg, 190 cm tall, with 10 % body fat. FFM = 100 × 0.90 = 90.0 kg. FFMI = 90.0 / 1.902 = 90.0 / 3.61 = 24.93 kg/m2. Correction = 6.3 × (1.80 − 1.90) = −0.63. Normalised FFMI = 24.93 − 0.63 = 24.30 kg/m2.
Boer example. A man weighing 75 kg, 178 cm tall, no body fat entered. LBM = 0.407 × 75 + 0.267 × 178 − 19.2 = 58.85 kg. FFMI = 58.85 / 1.782 = 18.57, normalised 18.70 kg/m2. The calculator also reports the implied body fat, 21.5 %, and labels it as an estimate.
How should I use the result?
- Track lean mass through a cut. If you are dropping weight before a race season, measure body fat the same way each time (same DXA machine, same hydration) and watch FFMI, not the scale. A stable FFMI with a falling body mass means the loss came mostly from fat mass. Pair it with the Weight Impact and Calorie calculators.
- Compare athletes of different heights. A 1.95 m rower and a 1.70 m climber with the same raw FFMI do not carry the same amount of muscle per unit of frame. The normalised value puts both on the 1.80 m scale.
- Use a tape instead of a scanner. No body fat measurement? Get an estimate from the Relative Fat Mass calculator, enter it here, and keep in mind that two estimates stacked together carry both errors.
What are the limits of FFMI?
- The 25.0 ceiling comes from 74 male athletes who reported no steroid use, inside a sample of 157 men (Kouri 1995). Self-report, one sample, and the authors called their findings preliminary. The 20 pre-steroid-era Mr. America winners in the same paper averaged 25.4, already above it.
- There is no equivalent women's ceiling in the paper, so none is shown.
- Body fat error flows straight into FFMI. A 3 percentage-point error on an 80 kg athlete moves lean mass by 2.4 kg, which is 0.74 kg/m2 at 1.80 m.
- The Boer estimate was built to normalise body fluid volumes, not to measure muscle. It returns the same answer for every athlete of the same sex, height and weight, so it cannot tell a rower from a desk worker.
- Schutz 2002 used bioimpedance in 5635 Swiss adults. The medians describe that sample and may not transfer to other populations. They are for raw FFMI, so they sit next to your raw value, not the normalised one.
- Kouri 1995 introduced the height correction as a slight adjustment to the height of a 1.80 m man, derived in male athletes. Below 150 cm or above 205 cm it grows past 1.6 kg/m2, and the calculator warns you that the correction is large. Those two heights are a TSN display choice, not a published threshold.
- Before anything is calculated, body mass (30 to 300 kg), height (120 to 230 cm) and any body fat you enter (2 to 70 percent) are checked against input ranges shared by every TSN calculator. These are data-entry checks set by TSN, not physiological norms. Without a body fat value, a Boer estimate that implies body fat under 2 percent or over 70 percent, as for some very light and tall people, gives no number and the tool asks for a measured body fat instead.
- Some other tools use 6.1 as the coefficient. Kouri 1995 prints 6.3, which is what is used here; for a 1.95 m athlete the two differ by 0.03 kg/m2.
⚠️ HEALTH & TRAINING GUIDANCE
Body composition numbers from a formula carry large individual error. Talk to a qualified sports medicine or nutrition professional before changing your training or eating based on this estimate.
ℹ️ IMPORTANT DISCLAIMER
This calculator is for educational purposes only and does NOT constitute medical advice. Consult qualified professionals before making changes. Individual physiology varies. You assume all risk. Must be 18+.
Frequently asked questions
What does a normalised FFMI above 25.0 mean?
Kouri 1995 measured 157 male athletes. In the 74 who reported no steroid use, normalised FFMI extended up to a limit of 25.0, and 20 pre-steroid-era Mr. America winners averaged 25.4. The authors called the findings preliminary. The calculator shows 25.0 as a reference point for men only, and a value above it says nothing certain about any one person.
Do I need a body fat measurement?
It helps a lot. Without one the calculator estimates lean mass with the Boer 1984 equation, which gives the same answer to every athlete of the same sex, height and weight. A 3 percentage-point body fat error on an 80 kg athlete moves lean mass by 2.4 kg, which is 0.74 kg/m2 of FFMI at 1.80 m.
What is a typical FFMI?
Schutz 2002 measured 5635 Swiss adults with bioimpedance. The median raw FFMI at ages 18 to 34 was 18.9 kg/m2 in men and 15.4 kg/m2 in women. Those medians are for raw FFMI, so the calculator shows them next to your raw value, not the normalised one.
Why 6.3 and not 6.1 in the height correction?
Kouri 1995 prints a correction of 6.3 x (1.80 m - height). Some other tools use 6.1. For a 1.95 m athlete the two differ by 0.03 kg/m2, so the choice matters little, but this calculator uses the published coefficient.
Why does the calculator sometimes show no number?
Body mass must be 30 to 300 kg, height 120 to 230 cm and any body fat you enter 2 to 70 percent. These are TSN data-entry checks, not physiological norms. Without a body fat value, a Boer estimate that implies body fat under 2 percent or over 70 percent gives no number, and the tool asks for a measured body fat instead.
Related calculators
- BMI Calculator
- Body Fat Calculator (US Navy Method)
- Body Roundness Index (BRI) Calculator
- Body Surface Area (BSA) Calculator
- All calculators on The Scientist's Notebook