BMI Calculator
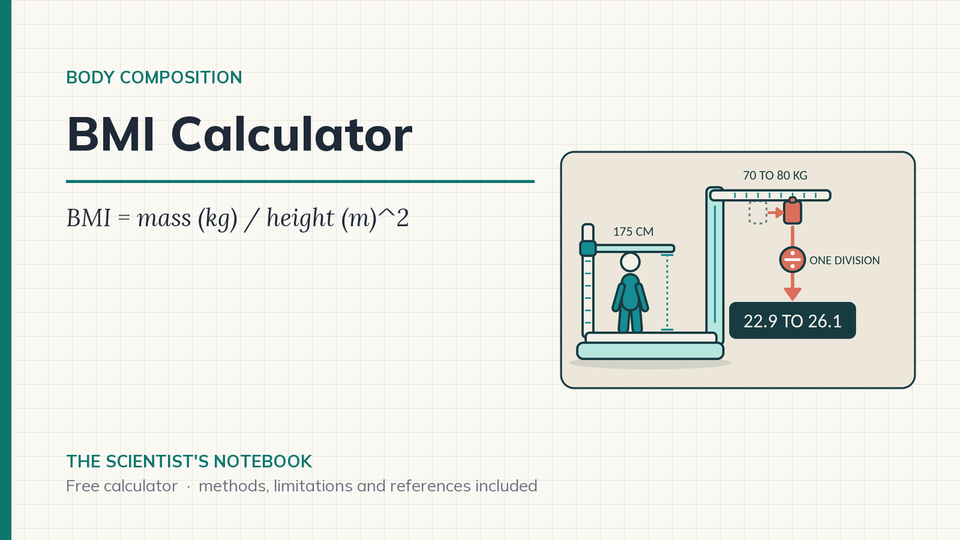
Body mass index is one division: body mass over height squared. This calculator gives you the number, its WHO band, and the range of body mass that corresponds to BMI 18.5 to 24.9 at your height.
In short: BMI is body mass in kilograms divided by height in metres squared. The WHO adult bands are under 18.5 underweight, 18.5 to 24.9 normal range, 25.0 to 29.9 overweight and 30.0 or more obesity. BMI cannot tell muscle from fat, so muscular athletes often read high. Use it as a first screen, then check body fat.
How is BMI calculated?
The index is body mass in kilograms divided by height in metres, squared. Adolphe Quetelet described the ratio in the 1830s, and the WHO adult cut-points have been in use since the late 1990s.
BMI = mass (kg) / height (m)2
- Band: under 18.5 underweight, 18.5 to 24.9 normal range, 25.0 to 29.9 overweight (pre-obese), 30.0 to 34.9 obesity class I, 35.0 to 39.9 class II, 40.0 or more class III. The value is rounded to one decimal first, so the number you see and the band always agree.
- BMI Prime: BMI divided by 25, the top of the normal range. A value of 1.00 means you sit on the upper edge. It is the same number rescaled and adds no information.
- Body-mass range at your height: 18.5 x height2 to 24.9 x height2, in kg.
- Asian-population action points: the WHO 2004 expert consultation proposed 23.0 and 27.5 kg/m2 as public-health action points for Asian populations. The calculator reports where you sit against them.
Worked example. 70 kg at 175 cm. Height squared is 1.75 x 1.75 = 3.0625. BMI = 70 / 3.0625 = 22.857, shown as 22.9 kg/m2, WHO normal range. BMI Prime = 22.857 / 25 = 0.91. The range for BMI 18.5 to 24.9 at 175 cm is 18.5 x 3.0625 = 56.7 kg to 24.9 x 3.0625 = 76.3 kg, so 70 kg is inside it.
How should an athlete use a BMI result?
- Treat it as a first screen, not a verdict. If you train hard and carry a lot of muscle, a BMI of 25 to 30 says little. Pair it with a body fat estimate (body fat calculator) and the fat-free mass index calculator to see whether the mass is lean or not.
- Use the range as a reference when planning a season. If you are building toward a climbing-heavy race, the range at your height shows the body mass interval that the BMI scheme calls normal. It is not a performance target. Weight impact shows what a change in mass does to climbing and flat speed.
- Check fuelling against mass changes. If body mass moves by several kilograms over a block, compare it with your intake in the calorie calculator before you read anything into the BMI change.
What can BMI not tell you?
- BMI cannot separate muscle from fat. In the NHANES III sample of 13,601 adults, a BMI of 30 or more had specificity of 95 percent in men and 99 percent in women for body-fat-defined obesity, but sensitivity of only 36 percent in men and 49 percent in women (Romero-Corral 2008). Within the 25 to 29.9 band, BMI failed to discriminate fat from lean mass in both sexes.
- In 226 college athletes and 213 non-athletes measured by air-displacement plethysmography, with overfatness set at 20 percent fat in men and 33 percent in women, using BMI 25 as the cut flagged many lean athletes as overweight. Specificity was 0.27 to 0.66 across male athletes, male non-athletes and female athletes. The BMI that best matched percent fat was 27.9 in male athletes and 27.7 in female athletes (Ode 2007).
- The mortality association is not a straight line. In a pooled review of 97 studies and 2.88 million people, overweight (25 to under 30) had a hazard ratio of 0.94 (95% CI 0.91 to 0.96) against the normal range, grade 1 obesity 0.95 (0.88 to 1.01) and grades 2 and 3 1.29 (1.18 to 1.41) (Flegal 2013). In never-smokers without chronic disease, mortality was lowest at 20.0 to 25.0 (Global BMI Mortality Collaboration 2016). The two analyses used different populations and exclusions, so read them as context, not as a target.
- One set of cut-points does not fit every population. The 2004 WHO consultation reviewed Asian populations, concluded that the BMI-to-risk relationship differs there, and proposed the 23.0 and 27.5 action points that the calculator reports.
- BMI says nothing about where fat sits, about fitness, or about any blood marker. The standard bands are for adults aged 18 and over. Under 18, BMI is read against growth-chart percentiles for the child's age and sex, which this tool does not do.
- This tool describes where a value falls in a population reference scheme. It does not assess your health or tell you what to do.
⚠️ HEALTH & TRAINING GUIDANCE
Individual results vary significantly. BMI is a population reference scheme and does not assess an individual's health. Consult a physician or registered dietitian before changing your eating, your body mass or your training based on this number.
ℹ️ IMPORTANT DISCLAIMER
This calculator is for educational purposes only and does NOT constitute medical advice. Consult qualified professionals before making changes. Individual physiology varies. You assume all risk. Must be 18+.
Frequently asked questions
How do you calculate BMI?
Divide body mass in kilograms by height in metres squared. At 70 kg and 175 cm, height squared is 1.75 x 1.75 = 3.0625, and 70 / 3.0625 = 22.857, shown as 22.9. The calculator rounds to one decimal before it picks the WHO band, so the number you see and the band always agree.
Is BMI accurate for athletes?
Often not. In 226 college athletes and 213 non-athletes measured by air-displacement plethysmography, using BMI 25 as the cut flagged many lean athletes as overweight. Specificity was 0.27 to 0.66 across male athletes, male non-athletes and female athletes. The BMI that best matched percent fat was 27.9 in male athletes and 27.7 in female athletes (Ode 2007). Pair BMI with a body fat estimate and the fat-free mass index.
What does mortality research say about BMI?
The link is not a straight line. A pooled review of 97 studies and 2.88 million people found a hazard ratio of 0.94 for overweight against the normal range, 0.95 for grade 1 obesity and 1.29 for grades 2 and 3 (Flegal 2013). In never-smokers without chronic disease, mortality was lowest at 20.0 to 25.0 (Global BMI Mortality Collaboration 2016). Read these as population context, not as a target.
Do Asian populations use different BMI cut-points?
The 2004 WHO expert consultation found that the BMI-to-risk relationship differs in Asian populations and proposed 23.0 and 27.5 as public-health action points. It kept the standard WHO bands as the international classification. The calculator reports where you sit against both.
What is BMI Prime?
BMI Prime is BMI divided by 25, the top of the WHO normal range (Gadzik 2006). A value of 1.00 means you sit on the upper edge. It is the same number rescaled and adds no information.
Related calculators
- Body Fat Calculator (US Navy Method)
- Body Roundness Index (BRI) Calculator
- Body Surface Area (BSA) Calculator
- Fat-Free Mass Index (FFMI) Calculator
- All calculators on The Scientist's Notebook
References
- Flegal et al. · 2013 · JAMA · PMID 23280227 · doi
- Global BMI Mortality Collaboration (Di Angelantonio et al.) · 2016 · Lancet · PMID 27423262 · doi
- WHO Expert Consultation · 2004 · Lancet · PMID 14726171 · doi
- Romero-Corral et al. · 2008 · Int J Obes · PMID 18283284 · doi
- Ode et al. · 2007 · Med Sci Sports Exerc · PMID 17473765 · doi
- Gadzik · 2006 · Conn Med · PMID 16768059
- World Health Organization · 2000 · Obesity: preventing and managing the global epidemic, WHO Technical Report Series 894 · not indexed in PubMed