Relative Fat Mass (RFM) Calculator
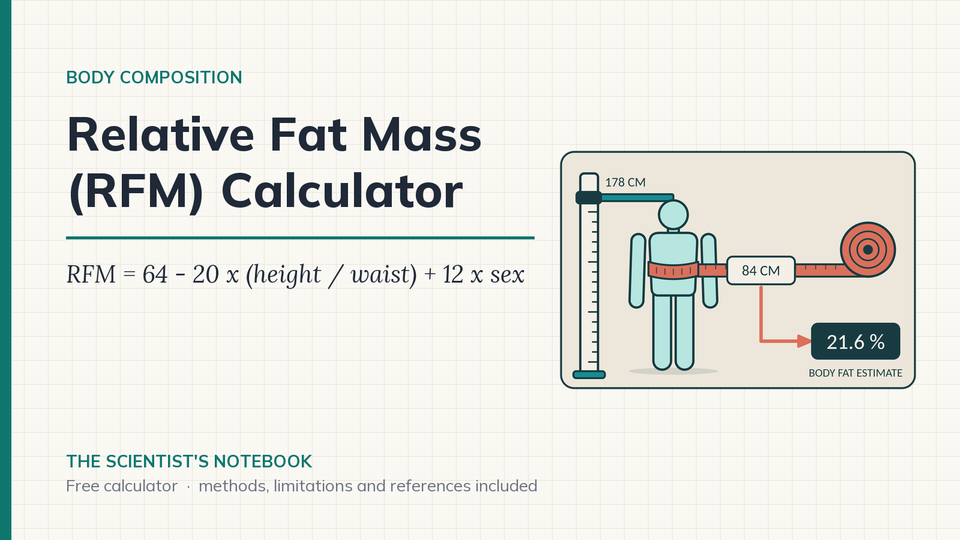
Relative fat mass (RFM) estimates your body fat percentage from two tape measurements, height and waist, with no scale involved. The equation was fitted against DXA scans in a large US adult survey.
In short: Relative fat mass (RFM) estimates body fat percentage from height and waist circumference: RFM = 64 - 20 x (height / waist) + 12 x sex, with sex 0 for men and 1 for women (Woolcott and Bergman 2018). It was fitted against DXA in US adults and needs only a tape measure, but it cannot see muscle mass.
How is relative fat mass calculated?
Woolcott and Bergman 2018 screened 365 anthropometric indices in NHANES 1999 to 2004 (12 581 adults) and kept the best linear equation. It was then tested in NHANES 2005 to 2006 (3456 adults), with DXA body fat as the reference.
RFM (%) = 64 − 20 × (height / waist circumference) + 12 × sex
Height and waist use the same unit, and sex is 0 for men and 1 for women. The calculator asks for biological sex and does not assume one. It rounds the result to 0.1 and shows where it sits against the 2020 follow-up analysis (Woolcott and Bergman 2020, 31 008 adults, 2517 deaths), which proposed rounded cutoffs of 30 % for men and 40 % for women, with reference groups below 25 % and below 35 %. If you enter body mass, fat mass = mass × RFM / 100 and lean mass is the remainder.
Worked example (man). Height 178 cm, waist 84 cm, body mass 75 kg. 178 / 84 = 2.119. RFM = 64 − 20 × 2.119 = 64 − 42.38 = 21.6 %. Fat mass = 75 × 0.2162 = 16.2 kg, lean mass 58.8 kg.
Worked example (woman). Height 168 cm, waist 74 cm. 168 / 74 = 2.270. RFM = 64 − 45.41 + 12 = 30.6 %.
How can athletes use their RFM result?
- Monthly tape check. Measure at the same spot on the first of the month and log the RFM. The calculator is most useful as a trend line from one tape and one person, because the method offset stays the same from month to month.
- Feed the FFMI calculator. If you have no scan, take the lean mass from this page and enter your RFM as the body fat value in the FFMI calculator. For the 75 kg man above at 178 cm, lean mass 58.8 kg gives a raw FFMI of 18.6 kg/m2. Two estimates stacked together carry both errors.
- Reconcile a smart scale. Bioimpedance scales and DXA can sit many points apart on the same body. In a 61-person comparison (Guzman-Leon 2019) RFM tracked DXA closely, while the regressions against air displacement, bioimpedance and a 4-compartment model had intercepts of about −10 to −14 points. Decide which reference you trust, and stick with it.
What are the limits of relative fat mass?
- RFM estimates DXA body fat percentage in general US adults. It has no input for muscle, so a heavily muscled athlete and a sedentary person with the same waist and height get the same number.
- The offset depends on the reference method. Against DXA, a 61-person Mexican validation sample (ages 20 to 37) gave R2 0.84 and an intercept of 1.12 points. Against air displacement, bioimpedance and a 4-compartment model the intercepts were −9.95, −12.6 and −13.6 points (Guzman-Leon 2019).
- The 2018 paper found RFM more accurate than BMI for body fat estimation, which is not the same as accurate for one person. Individual error remains.
- The 30 % and 40 % values are population cutoffs tied to all-cause mortality in NHANES. Adjusted hazard ratios were 1.57 (95% CI 1.07 to 2.30) for men at 30.0 to 34.9 % against below 25 %, and 1.41 (1.02 to 1.95) for women at 40.0 to 44.9 % against below 35 %. They are not a medical assessment.
- Tape position changes the result. The equation divides height by waist, so a waist reading that is 2 cm higher on a 178 cm person with an 84 cm waist moves RFM by 1.0 percentage point.
- The calculator refuses a waist equal to or larger than the height and an equation result outside 2 to 70 %. Below 4 % or above 50 % it shows the estimate with a warning to re-check the tape.
- Adults only. The equation was fitted on adults aged 20 and over. Use for children and adolescents is outside this calculator.
⚠️ HEALTH & TRAINING GUIDANCE
A body fat estimate from two tape measurements carries individual error and cannot see muscle. Talk to a qualified health or sports medicine professional before changing training or nutrition based on this number.
ℹ️ IMPORTANT DISCLAIMER
This calculator is for educational purposes only and does NOT constitute medical advice. Consult qualified professionals before making changes. Individual physiology varies. You assume all risk. Must be 18+.
Frequently asked questions
How do you calculate relative fat mass?
Divide height by waist circumference, multiply by 20 and subtract the result from 64. Women add 12. A man 178 cm tall with an 84 cm waist gets 64 - 20 x 2.119 = 21.6 %. With a body mass of 75 kg that is 16.2 kg of fat and 58.8 kg of lean mass.
What do the 30 % and 40 % RFM values mean?
Woolcott and Bergman 2020 proposed rounded cutoffs of 30 % for men and 40 % for women in NHANES data (31 008 adults, 2517 deaths). Adjusted hazard ratios for all-cause mortality were 1.57 for men at 30.0 to 34.9 % and 1.41 for women at 40.0 to 44.9 %, against the reference groups. They are population cutoffs, not a medical assessment.
Is RFM accurate for athletes?
It was fitted on general US adults aged 20 and over, with DXA as the reference, and has no input for muscle. In a 61-person Mexican sample RFM tracked DXA with R2 0.84, but against air displacement, bioimpedance and a 4-compartment model the intercepts were about minus 10 to minus 14 points (Guzman-Leon 2019). Use it as a trend from one tape.
Why does the calculator refuse some readings?
A waist equal to or larger than the height is refused as a typing error, and so is an equation result outside 2 to 70 %. Below 4 % or above 50 % the estimate is shown with a warning to re-check the tape. Body mass is optional and is used only to turn the percentage into kilograms.
Related calculators
- BMI Calculator
- Body Fat Calculator (US Navy Method)
- Body Roundness Index (BRI) Calculator
- Body Surface Area (BSA) Calculator
- All calculators on The Scientist's Notebook