Waist-to-Height Ratio Calculator
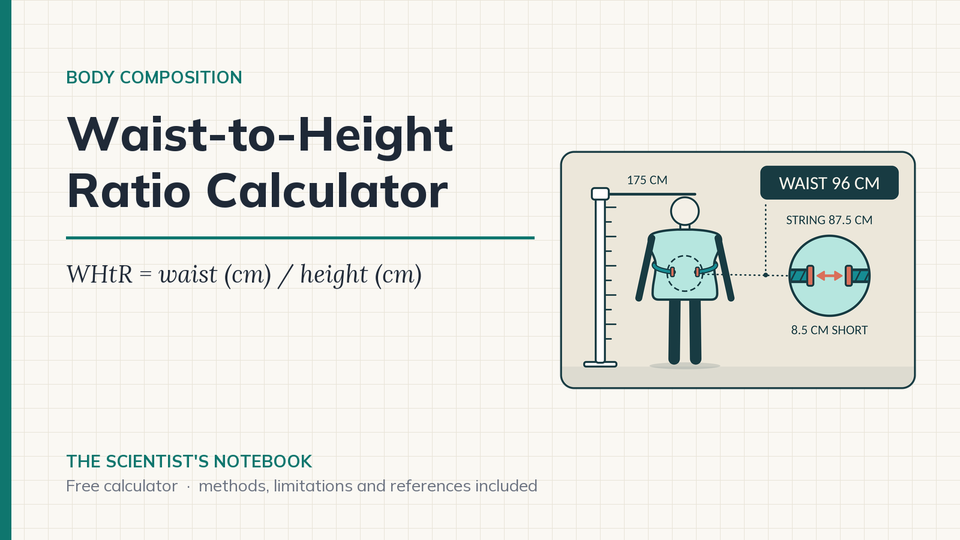
Waist-to-height ratio (WHtR) is waist circumference divided by height, and the screening message built on it is short: keep your waist under half your height. It needs a tape and nothing else, which makes it a useful check for athletes whose BMI says very little.
In short: Waist-to-height ratio is waist circumference divided by height, both in centimetres. A ratio under 0.5, a waist under half your height, is the main screening boundary of the Ashwell Shape Chart, which also marks 0.4 and 0.6. It needs only a tape, which makes it a useful check for athletes whose BMI says very little.
How is waist-to-height ratio calculated?
WHtR = waist circumference (cm) / height (cm). Both numbers are in the same unit, so the ratio has no unit. The calculator rounds it to two decimals and compares that displayed value with the boundary values of the Ashwell Shape Chart, as described in Ashwell and Gibson 2014. The same boundaries apply to men and women, so no sex or age is asked.
| Ratio | Region on the Shape Chart |
|---|---|
| below 0.40 | lower region |
| 0.40 to 0.49 | below the 0.5 boundary |
| 0.50 to 0.59 | at or above the 0.5 boundary |
| 0.60 and above | at or above the 0.6 boundary |
The calculator also turns each boundary back into a waist size for your height: waist at 0.5 = height × 0.5, and likewise for 0.4 and 0.6.
Worked example. Waist 96 cm, height 175 cm. WHtR = 96 / 175 = 0.5486, displayed as 0.55, in the 0.50 to 0.59 region. The waist at 0.5 is 175 × 0.5 = 87.5 cm, so this waist is 8.5 cm above it. The waists at 0.4 and 0.6 are 70.0 cm and 105.0 cm.
How can athletes use their waist-to-height ratio?
- Track a season with a tape. Measure your waist on the first of every month, same landmark, same time of day, and enter it with your height. The change in centimetres to the 0.5 waist value is easier to read than a change in ratio.
- Check what BMI hides. Ashwell and Gibson 2014 estimated that more than 25 % of UK adults judged normal weight by BMI were misclassified when WHtR was applied. If your BMI looks fine but your ratio is 0.5 or higher, that is a prompt for a conversation with a health professional, not a verdict.
- Cross-check with shape and fat estimates. The same two tape measurements feed the Body Roundness Index and the Relative Fat Mass calculators, so one measuring session gives you three views of central adiposity.
What are the limits of waist-to-height ratio?
- The boundaries come from general-population studies. Ashwell 2012 pooled 31 papers and more than 300 000 adults and found that the ratio improved discrimination of cardiometabolic risk factors by 4 to 5 % over BMI, but the work cited here did not set a boundary specific to trained endurance athletes.
- A single 0.5 value across ethnic groups is a screening convenience (Browning 2010). It does not mean risk is identical at 0.5 in every population.
- The ratio describes cohorts, not you. It is not a medical assessment, and it says nothing about fitness, blood markers or training status.
- Waist measurement protocols differ (narrowest point, navel level, midway between lowest rib and hip bone). The boundary values do not specify one, so choose a landmark and keep it.
- The band is chosen from the two-decimal value shown. A waist that gives 0.495 displays as 0.50 and lands in the upper region, and the calculator flags readings that close to the boundary.
- This page is for adults. Child and adolescent use needs age-specific interpretation and is not covered.
⚠️ HEALTH & TRAINING GUIDANCE
A tape-measure ratio is a population screening tool and carries individual error. Talk to a qualified health or sports medicine professional before changing training or nutrition based on this number.
ℹ️ IMPORTANT DISCLAIMER
This calculator is for educational purposes only and does NOT constitute medical advice. Consult qualified professionals before making changes. Individual physiology varies. You assume all risk. Must be 18+.
Frequently asked questions
How do you calculate waist-to-height ratio?
Divide waist circumference by height in the same unit. A waist of 96 cm at a height of 175 cm gives 96 / 175 = 0.5486, shown as 0.55. The waist at a ratio of 0.5 is half your height, here 87.5 cm, so this waist sits 8.5 cm above it.
What do the 0.4, 0.5 and 0.6 boundaries mean?
They split the Ashwell Shape Chart into four regions: below 0.4, 0.4 to 0.5, 0.5 to 0.6 and above 0.6. The 0.5 value was proposed as one boundary across ethnic groups (Browning 2010). The same values apply to men and women. They describe population screening regions, not your health.
Is waist-to-height ratio better than BMI?
In general populations, a pooled analysis of 31 papers and more than 300 000 adults found that the ratio improved discrimination of cardiometabolic risk factors by 4 to 5 % over BMI (Ashwell 2012). Ashwell and Gibson 2014 estimated that more than 25 % of UK adults judged normal weight by BMI were misclassified when the ratio was applied. Neither study set a boundary for trained athletes.
Where should I measure my waist?
Protocols differ: narrowest point, navel level, or midway between the lowest rib and the hip bone. The boundary values do not specify one, so pick one landmark and keep it. Measure at the same time of day and repeat the measurement if your ratio lands right next to 0.5.
Related calculators
- BMI Calculator
- Body Fat Calculator (US Navy Method)
- Body Roundness Index (BRI) Calculator
- Body Surface Area (BSA) Calculator
- All calculators on The Scientist's Notebook