Protein Intake Calculator
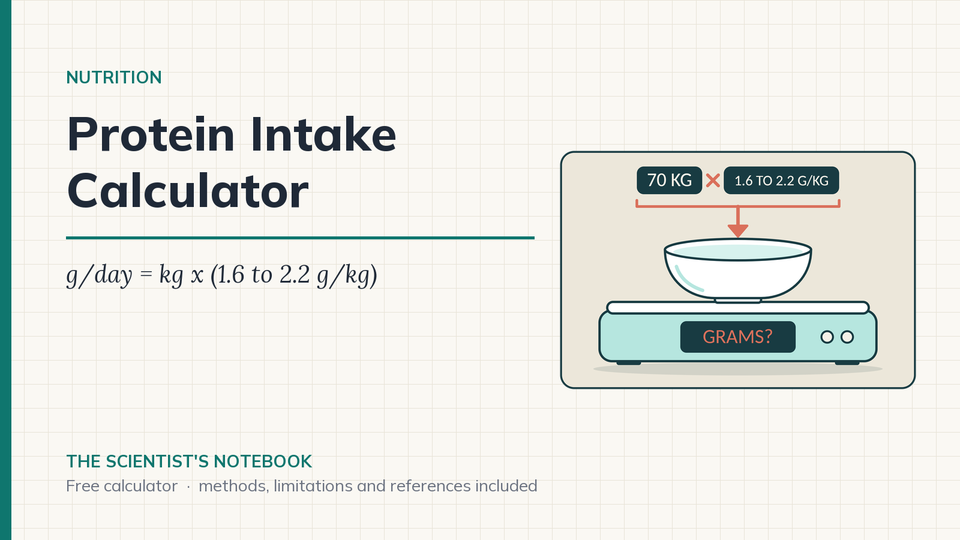
Daily protein targets in the literature are ranges, and the range depends on what you do with your training. This calculator picks the published range for your profile and turns it into grams.
In short: The calculator multiplies your body mass by the published g/kg/day range for your training profile and shows the midpoint. On the strength profile that is 1.6 to 2.2 g/kg, so a 70 kg athlete gets 112 to 154 g a day. The fat loss profile works per kg of lean mass and needs your body fat.
How is the protein range calculated?
Protein (g/day) = reference mass (kg) x g/kg/day, calculated once with the lower value and once with the upper value of the range for your profile. The headline number is the midpoint of the two rounded gram values.
- Sedentary: 0.8 to 1.2 g/kg. The lower value is the adult RDA. The upper value is the low end of the 1.2 to 1.6 g/kg range that Phillips and colleagues (2016) argued is a better target for health outcomes.
- Lightly active: 1.0 to 1.4 g/kg. No study reports this band directly, so it is an interpolation between the RDA and the sports nutrition lower bound.
- Moderate training: 1.2 to 1.6 g/kg. The lower value is the ACSM/AND/DC position stand (Thomas 2016). The upper value is the 1.62 g/kg break point from the Morton 2018 meta-analysis.
- Strength training: 1.6 to 2.2 g/kg. Morton 2018 found a break point of 1.62 g/kg/day with a 95 % confidence interval of 1.03 to 2.20.
- Intense endurance training: 1.6 to 2.0 g/kg, the upper half of the ACSM/AND range (1.2 to 2.0) and inside the ISSN range of 1.4 to 2.0 (Jager 2017).
- Fat loss phase: 2.3 to 3.1 g per kg of lean body mass (Helms 2014). The ISSN position stand (Jager 2017) gives the same 2.3 to 3.1 g/kg/day for resistance-trained people in an energy deficit without naming lean mass; the calculator uses the lean-mass reading, which gives the lower gram figure. Lean mass = body mass x (1 - body fat % / 100), so this profile needs a body fat value and will not run without one.
If you enter an age of 65 or more, the calculator follows the PROT-AGE position paper (Bauer 2013): the sedentary range becomes 1.0 to 1.2 g/kg, and every training profile gets a lower bound of at least 1.2 g/kg, the value PROT-AGE gives for older adults who exercise. A 70 year old on the lightly active profile therefore gets 1.2 to 1.4 g/kg instead of 1.0 to 1.4.
Worked example
70 kg athlete on the strength profile: 70 x 1.6 = 112 g and 70 x 2.2 = 154 g. Midpoint = (112 + 154) / 2 = 133 g/day, or 1.9 g/kg.
80 kg athlete at 15 % body fat in a fat loss phase: lean mass = 80 x 0.85 = 68 kg. Range = 68 x 2.3 = 156 g to 68 x 3.1 = 211 g. Midpoint = 184 g/day. Per kg of body mass that is 1.95 to 2.64 g/kg.
How do I use the result?
- Set a floor for a build block. A 70 kg cyclist on the intense endurance profile gets 112 to 140 g/day. Sit inside the range on high-volume weeks, when energy intake is the thing most likely to slip. Size the energy side with the calorie calculator first.
- Split the total into meals. A daily number says nothing about distribution. The protein timing calculator turns the same body mass into a per-meal dose and a meal count.
- Stop chasing the top of the range. The pooled data flatten out near 1.6 g/kg for fat-free mass gain. If you are already inside the range, extra protein is more likely to crowd out carbohydrate than to add anything measurable. Check your carbohydrate plan in the daily carbohydrate calculator before raising protein.
What are the limits?
- The Morton 2018 break point (1.62 g/kg/day) comes from resistance-training trials with protein supplementation and was not statistically significant as a segmented fit (p = 0.079). The confidence interval of 1.03 to 2.20 shows how loosely it pins down any one person.
- The ISSN and ACSM/AND ranges are expert consensus built on trials with different designs, participants and measurement methods. They are ranges for groups.
- The lightly active band (1.0 to 1.4 g/kg) is an interpolation, not a reported range.
- The fat loss range comes from a small evidence base in resistance-trained, lean people. It was set per kg of lean mass for that reason and should not be read as a target for everyone in a deficit.
- The calculator sizes the daily total only. It does not model protein quality, amino acid content, meal timing or total energy intake.
- If you have been told to limit protein, for example because of kidney disease, follow that advice. Pregnancy, breastfeeding, illness and recovery from surgery change protein needs in ways this tool does not model.
- Body fat from field methods carries measurement error, and every 1 percentage point of error moves the lean mass in the fat loss profile by 1 % of body mass.
⚠️ HEALTH & TRAINING GUIDANCE
Protein ranges are group averages and individual results vary significantly. Consult a registered dietitian or physician before changing your protein intake, especially if you have a kidney, liver or metabolic condition.
ℹ️ IMPORTANT DISCLAIMER
This calculator is for educational purposes only and does NOT constitute medical advice. Consult qualified professionals before making changes. Individual physiology varies. You assume all risk. Must be 18+.
Frequently asked questions
How much protein do I need per day?
It depends on your training. The calculator uses 0.8 to 1.2 g/kg/day for sedentary adults, 1.2 to 1.6 for moderate training, 1.6 to 2.2 for strength training and 1.6 to 2.0 for intense endurance training. The ISSN position stand puts most exercising people at 1.4 to 2.0 g/kg/day.
Is more than 1.6 g/kg of protein useful?
In the Morton 2018 meta-analysis of resistance-training trials, extra protein stopped adding fat-free mass at about 1.62 g/kg/day on average, with a 95 % confidence interval of 1.03 to 2.20. The top of the strength range covers individual variation, not a larger average gain.
Why does the fat loss profile need my body fat?
Helms 2014 gives 2.3 to 3.1 g per kg of lean body mass for lean, resistance-trained people in an energy deficit. Lean mass = body mass x (1 - body fat % / 100). The calculator never guesses body fat, so this profile will not run without it.
Do older adults need more protein?
From age 65 the calculator follows the PROT-AGE position paper (Bauer 2013): the sedentary range becomes 1.0 to 1.2 g/kg/day and every training profile gets a lower bound of at least 1.2 g/kg/day, the value given for older adults who exercise.
Who should not use this protein range?
Anyone who has been told by a clinician to limit protein, for example because of kidney disease, should follow that advice. Pregnancy, breastfeeding, illness and recovery from surgery change protein needs in ways this calculator does not model.
Related calculators
- Caffeine Dose Calculator for Endurance
- Daily Carbohydrate Intake Calculator
- Creatine Loading and Maintenance Calculator
- Fat Intake Calculator
- All calculators on The Scientist's Notebook
References
- Morton et al. · 2018 · Br J Sports Med · PMID 28698222 · doi
- Jager et al. · 2017 · J Int Soc Sports Nutr · PMID 28642676 · doi
- Thomas et al. · 2016 · Med Sci Sports Exerc · PMID 26891166 · doi
- Helms et al. · 2014 · J Int Soc Sports Nutr · PMID 24864135 · doi
- Phillips et al. · 2016 · Appl Physiol Nutr Metab · PMID 26960445 · doi
- Bauer et al. · 2013 · J Am Med Dir Assoc · PMID 23867520 · doi
- Institute of Medicine · 2005 · Dietary Reference Intakes for Energy, Carbohydrate, Fiber, Fat, Fatty Acids, Cholesterol, Protein, and Amino Acids. National Academies Press · not indexed in PubMed