Entry #034: Reading Training Load: The Fitness-Fatigue Balance
Two athletes finish the exact same twelve week block: same sessions, same hours, same numbers logged to the watch. One arrives at the start line sharp and springy, holding goal pace as if it were a warm up.
The other arrives flat, heavy legged, and runs a personal worst. Nothing in the raw diary explains the gap, because the total work was identical.
What differed was timing: how each body banked the slow, durable gains while clearing the fast, draining cost that produced them. That gap, between the work done and the form that shows up, is the whole story of training load.
This entry is about how a single training session splits, almost the moment it ends, into two competing aftereffects. One is a slow rising line of fitness that compounds across weeks and fades only grudgingly.
The other is a faster line of fatigue that climbs steeply with each hard day and then drains away within days. Your readiness on any given morning is not your fitness and it is not your fatigue.
It is the distance between them. Understanding that distance, and the simple weighted averages that try to estimate it, separates training that compounds from training that quietly digs a hole.
The goal here is to read the chart, not to worship it. A training load chart is a model, and models are useful lies: they compress thousands of heartbeats and watts and footstrikes into a few smooth curves, discarding almost everything that makes one athlete different from another.
The numbers can flag that load is rising faster than the body has absorbed it. They cannot say whether that rise is the productive kind that builds an engine or the reckless kind that breaks a tendon.
That judgment belongs to a human reading the trend in context. What this entry leaves aside is how a single session is scored in the first place. Converting heart rate, power, and perceived effort into one daily load number is its own subject, with its own assumptions and failure modes, and deserves separate treatment.
The plans you find here are built on a simple truth: Adaptation only happens when you apply the right stress, at the right time, in the right dose.
 Thomas Mortelmans
The brief
- Every training session creates two opposing effects at once. It builds a slow decaying fitness and a fast decaying fatigue, and your form is the difference between them.
- Fatigue fades faster than fitness, which is why tapering works. Cut the load for a week or two and fatigue drains while most of the hard won fitness stays, so form rises into a peak.
- Chronic Load is the long horizon, Acute Load is the short one. A roughly six week weighted average of daily load stands in for fitness, while a roughly one week average stands in for fatigue.
- Load Balance is freshness expressed as a single number. Chronic Load minus Acute Load: positive means rested and ready, deeply negative means buried under recent work.
- The acute to chronic ratio tries to flag dangerous spikes. Many studies report lower injury rates when recent load stays near established load rather than jumping far above it.
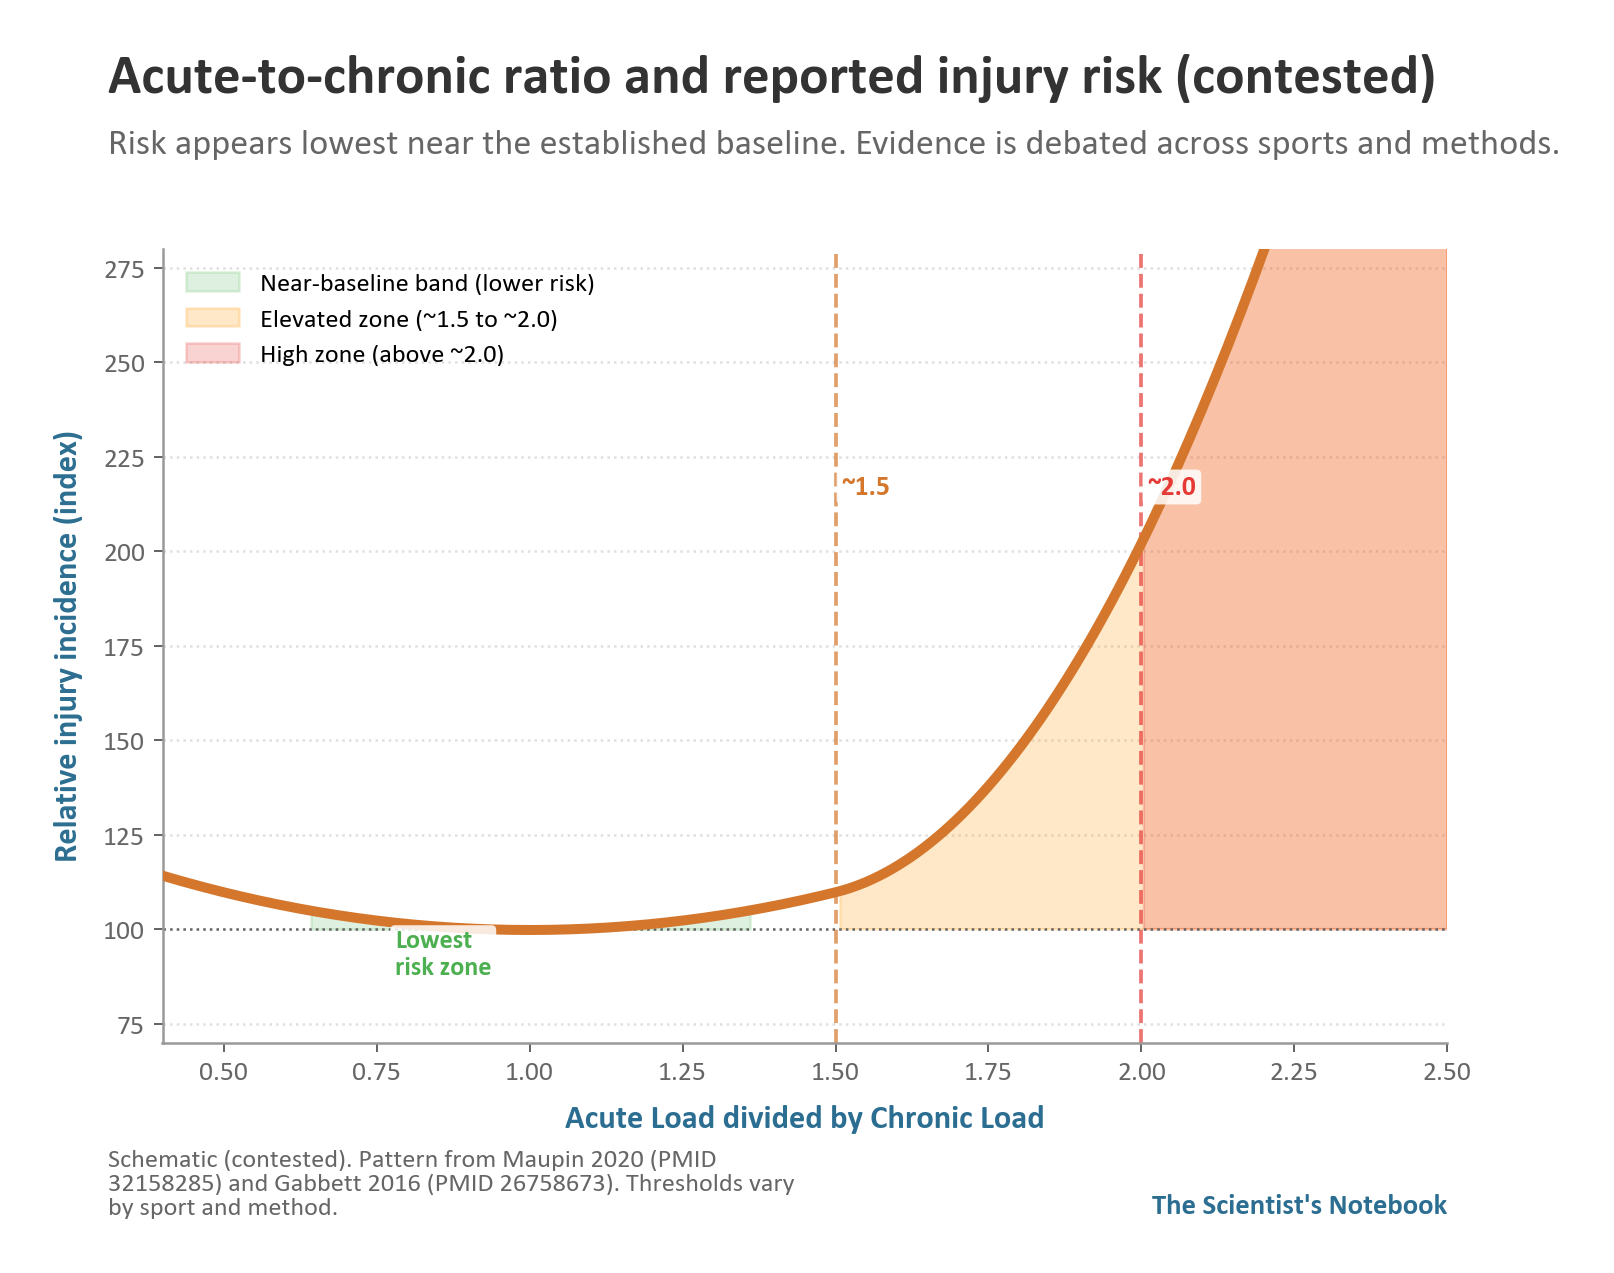
- The famous safe zone is contested, not settled. The proposed sweet spot has real supporters and serious statistical critics, and some athlete groups do fine well outside it.
- A single load number hides the modality and the individual. The same score from easy miles and from heavy intervals stresses very different tissues, and identical work changes very different bodies.
- Garbage in still means garbage out. If the daily score is wrong, every curve and ratio built on top of it inherits the error, no matter how sophisticated the math looks.
The science at a glance
Foundational Principle 1: One dose, two opposite aftereffects
The core idea is almost embarrassingly simple, which is why it took decades to formalize. A bout of training is a single input, but the body answers with two responses on different clocks.
One is positive and durable: the accumulated upgrades, from a denser capillary network to better fuel handling, that raise your ceiling and erode only slowly when training stops.
The other is negative and transient: the immediate disturbance of hard work, the emptied stores and frayed tissue and dulled nervous system, that drags performance down but clears within days.
Measured performance at any instant is the sum of the positive aftereffects minus the negative ones.
Because the two curves rise and fall at such different rates, the same training history can read as brilliant form or as a deep hole depending only on when you look.
Scientist's Insight: The session is not the adaptation. The session is the invoice, and fitness is what you can afford only after the fatigue bill clears.
Foundational Principle 2: Exponential memory, two time constants
To turn that idea into a chart you need a way to let old training fade.
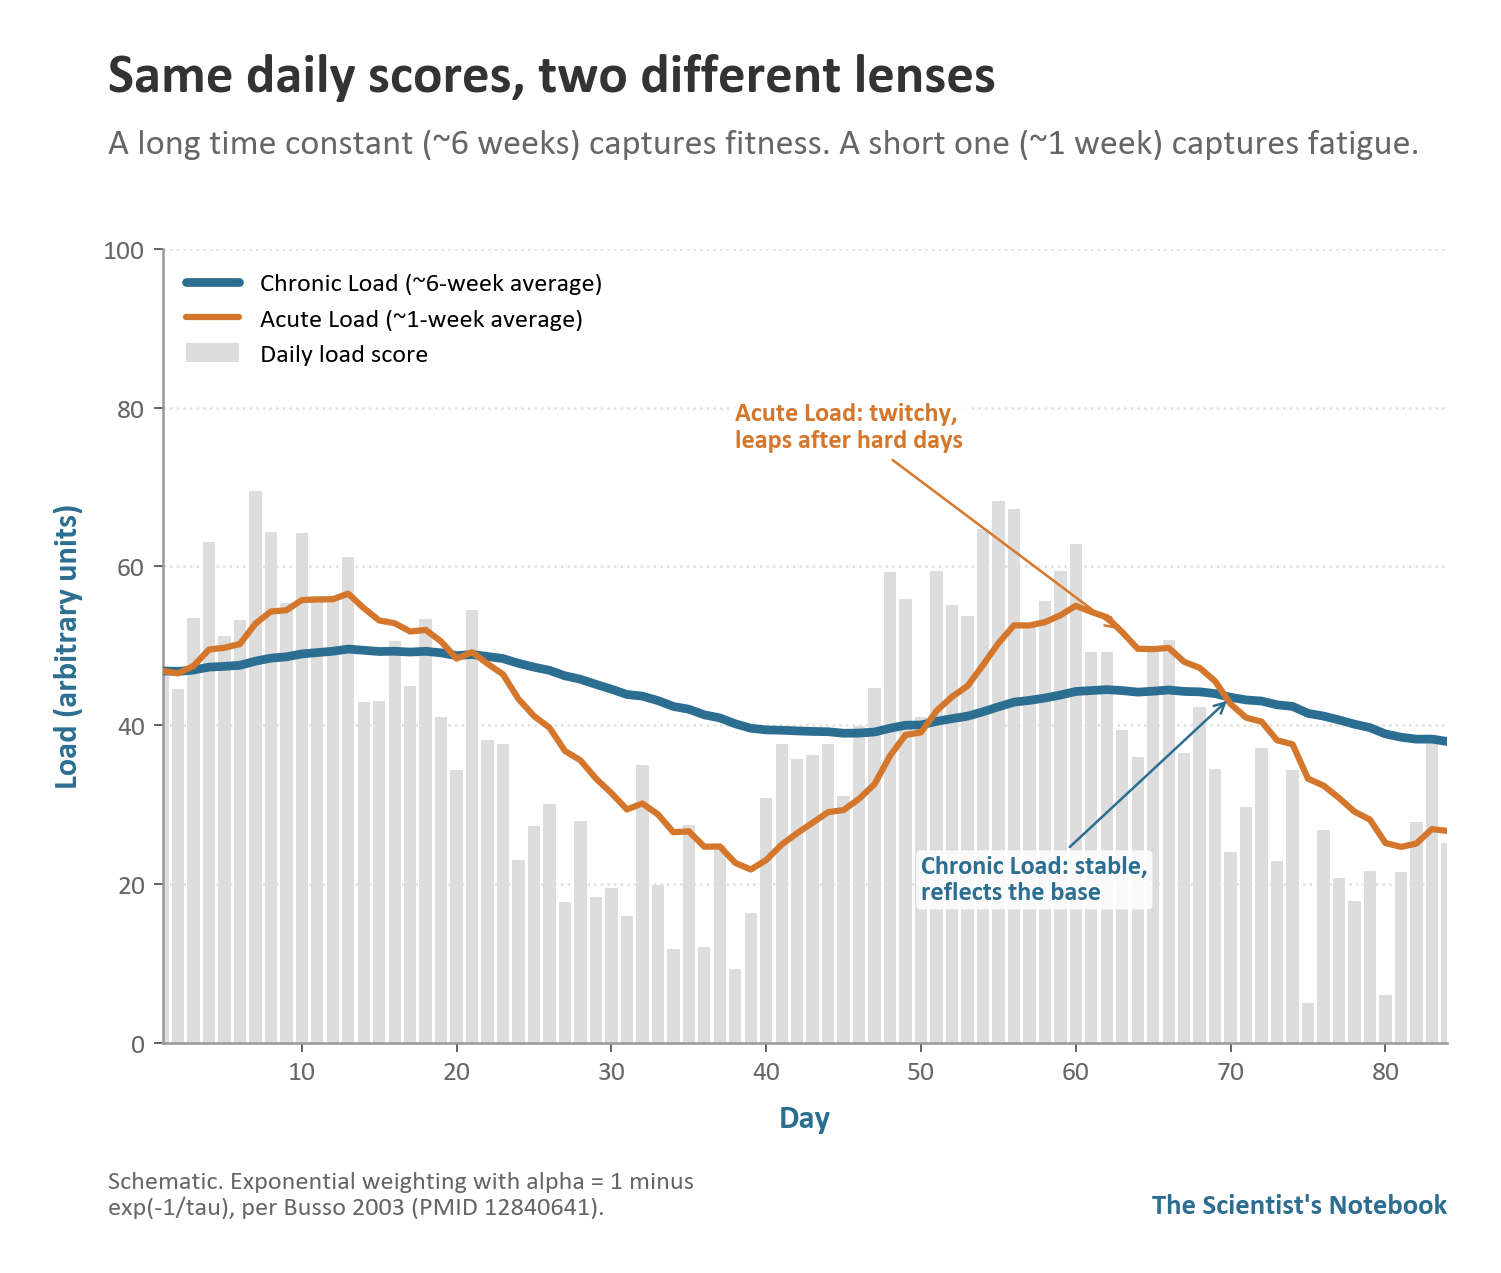
The tool is the exponentially weighted average, which remembers recent days vividly and lets each older day count for a little less than the one after it, the fade governed by a single time constant.
Run it with a long time constant, on the order of six weeks, and you get a stable line that climbs and sags slowly: a stand in for accumulated fitness, the Chronic Load.
Run the same machinery with a short time constant, on the order of one week, and you get a twitchy line that leaps after hard days and settles quickly: a stand in for fatigue, the Acute Load. Both lines come from the identical daily scores.
The only difference is how fast each one forgets, and that choice separates the durable signal from the volatile one.
Scientist's Insight: Fitness and fatigue are not different measurements. They are the same measurement viewed through a slow lens and a fast one.
Foundational Principle 3: Form is the gap, and the gap can be steered
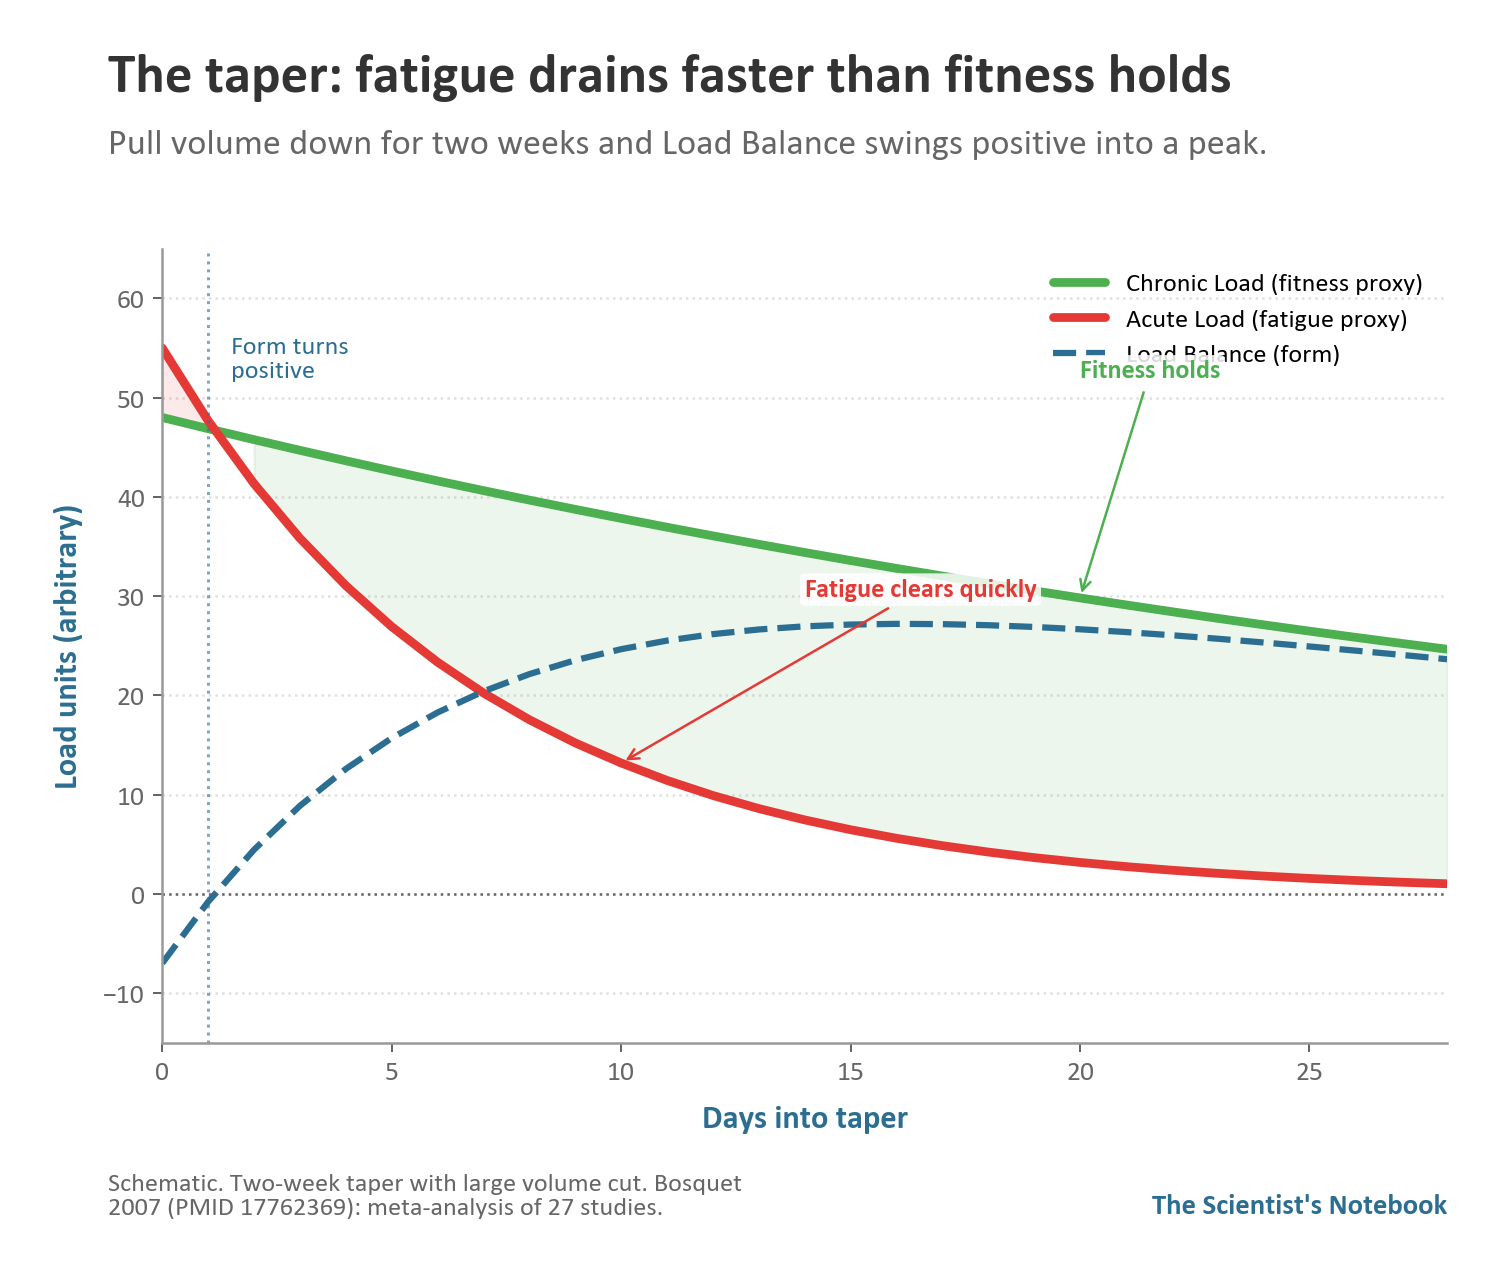
If Chronic Load tracks fitness and Acute Load tracks fatigue, then freshness is the distance between them, the Load Balance. When recent work piles up faster than the long line can rise, the balance goes negative and the legs feel it.
When recent work backs off while the long line holds, the balance swings positive and a window of sharpness opens.
This is the mechanism behind the taper, and the research is unusually consistent: pull volume down substantially for roughly two weeks while keeping intensity honest, and performance reliably improves because fatigue drains far faster than fitness.
The art is not in the formula but in judging how deep and how long to dip so the fatigue clears without the fitness sliding.
Scientist's Insight: A peak is not built in the taper. It is uncovered, by removing the fatigue that was hiding fitness already in the bank.
Reading the signals
Lever 1: How fast recent load climbs above established load
The data: a large body of team sport research has compared a one week window against a three to six week baseline and asked how injury rates track that ratio.
Across many cohorts, injury incidence tends to be lowest when recent load sits near the established baseline and rises when it spikes far above it, with some datasets flagging sharply elevated risk once the ratio climbs past roughly one and a half and higher still beyond two.
The interaction matters more than the raw number: non contact injuries cluster where a high recent load lands on a low underlying base, while athletes who already carry a high chronic base and push higher show little added risk.
Where athletes tend to land: in the pooled studies, the clusters with the fewest injuries fell in a band where recent load stayed close to baseline, and those who tolerated big weeks best had spent months building the base first.
The same hard week that breaks an undertrained athlete is routine for a well prepared one.
Lever 2: How the load history is mathematically smoothed
The data: two ways of computing these averages dominate the literature, and they do not agree. The simpler approach takes flat windows, averaging the last seven and the last twenty eight days with every day weighted equally.
The refined approach uses exponential weighting, letting recent days count for more and older days fade smoothly, which better mirrors how fatigue and adaptation actually decay.
Studies comparing the two repeatedly find the exponential version more sensitive at the highest risk ranges, because flat windows blur the recent spikes that matter most and create artificial cliffs when a hard day drops out of the window.
Where athletes tend to land: across comparison studies, exponential weighting more often separated higher from lower risk periods while flat windows smeared them together, which is why the field now defaults to it. No smoothing rescues a flawed input.
Lever 3: How much trust the single ratio actually earns
The data: the ratio has drawn serious statistical criticism, and the critiques are not fringe.
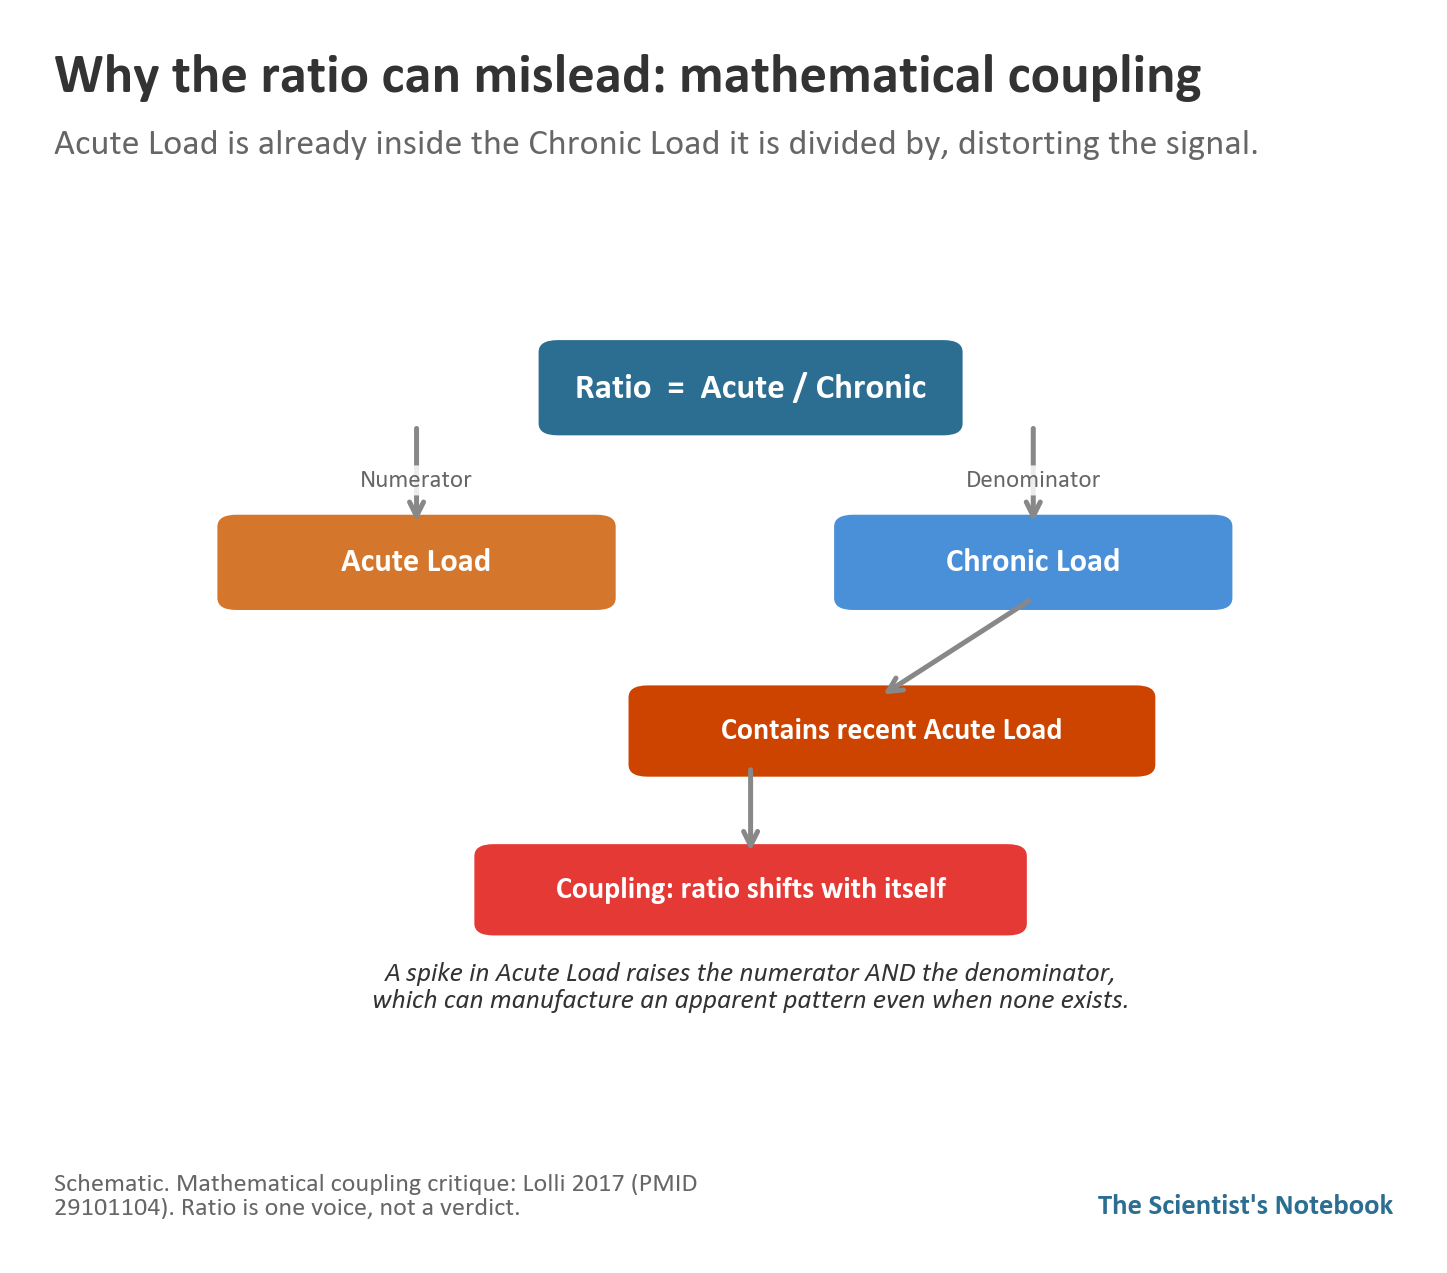
A central objection is mathematical coupling: the recent load is itself baked into the longer term average it is divided by, which can manufacture an apparent ratio to injury relationship even when none exists in the underlying loads.
Other analyses found that recent load spikes failed to predict injuries in some professional cohorts, and that conclusions flip depending on which load variable and windows are chosen.
The proposed safe zone rests on heterogeneous studies, and several elite groups train comfortably across a far wider range without the predicted penalty.
Where athletes tend to land: in practice the ratio behaves like a smoke detector, not a diagnosis. Studies that integrate it with recovery markers, perceived wellness, and performance trends draw steadier conclusions than those that lean on the ratio alone.
Treated as one input among many, the number carries modest value; treated as a verdict, it overpromises.
Method and a worked example
The studies behind these curves share a recognizable skeleton, and seeing it makes the charts easier to read honestly.
Method
- Assign every session a single daily load score, blending duration and intensity, so a short brutal session and a long gentle one sit on the same axis.
- Feed those scores into two exponentially weighted averages, a long one near six weeks for the fitness proxy and a short one near one week for the fatigue proxy.
- Track the difference between the two lines as the freshness signal, and the ratio of the short line to the long line as the spike detector.
- Log outcomes over weeks and months, recording injuries, illnesses, and performance tests rather than how the athlete felt that day.
- Compare outcome rates across bands of the ratio and the balance, then test whether the relationships survive once mathematical coupling and individual baselines are accounted for.
A composite case
Consider a generic masters runner returning after a quiet winter, no single real counterpart, just a familiar shape. The long line starts low because the base eroded over months of rest.
Early in the rebuild the runner feels unexpectedly bad: a few honest weeks send the short line climbing while the long line barely moves, the balance plunges negative, and the legs protest out of proportion to the modest mileage.
That early dip is not a warning of injury so much as the predictable cost of asking a detrained body to work again.
Weeks pass and the long line finally lifts. The runner grows bolder, stacks a heavy block, and pushes the ratio well above the comfortable band.
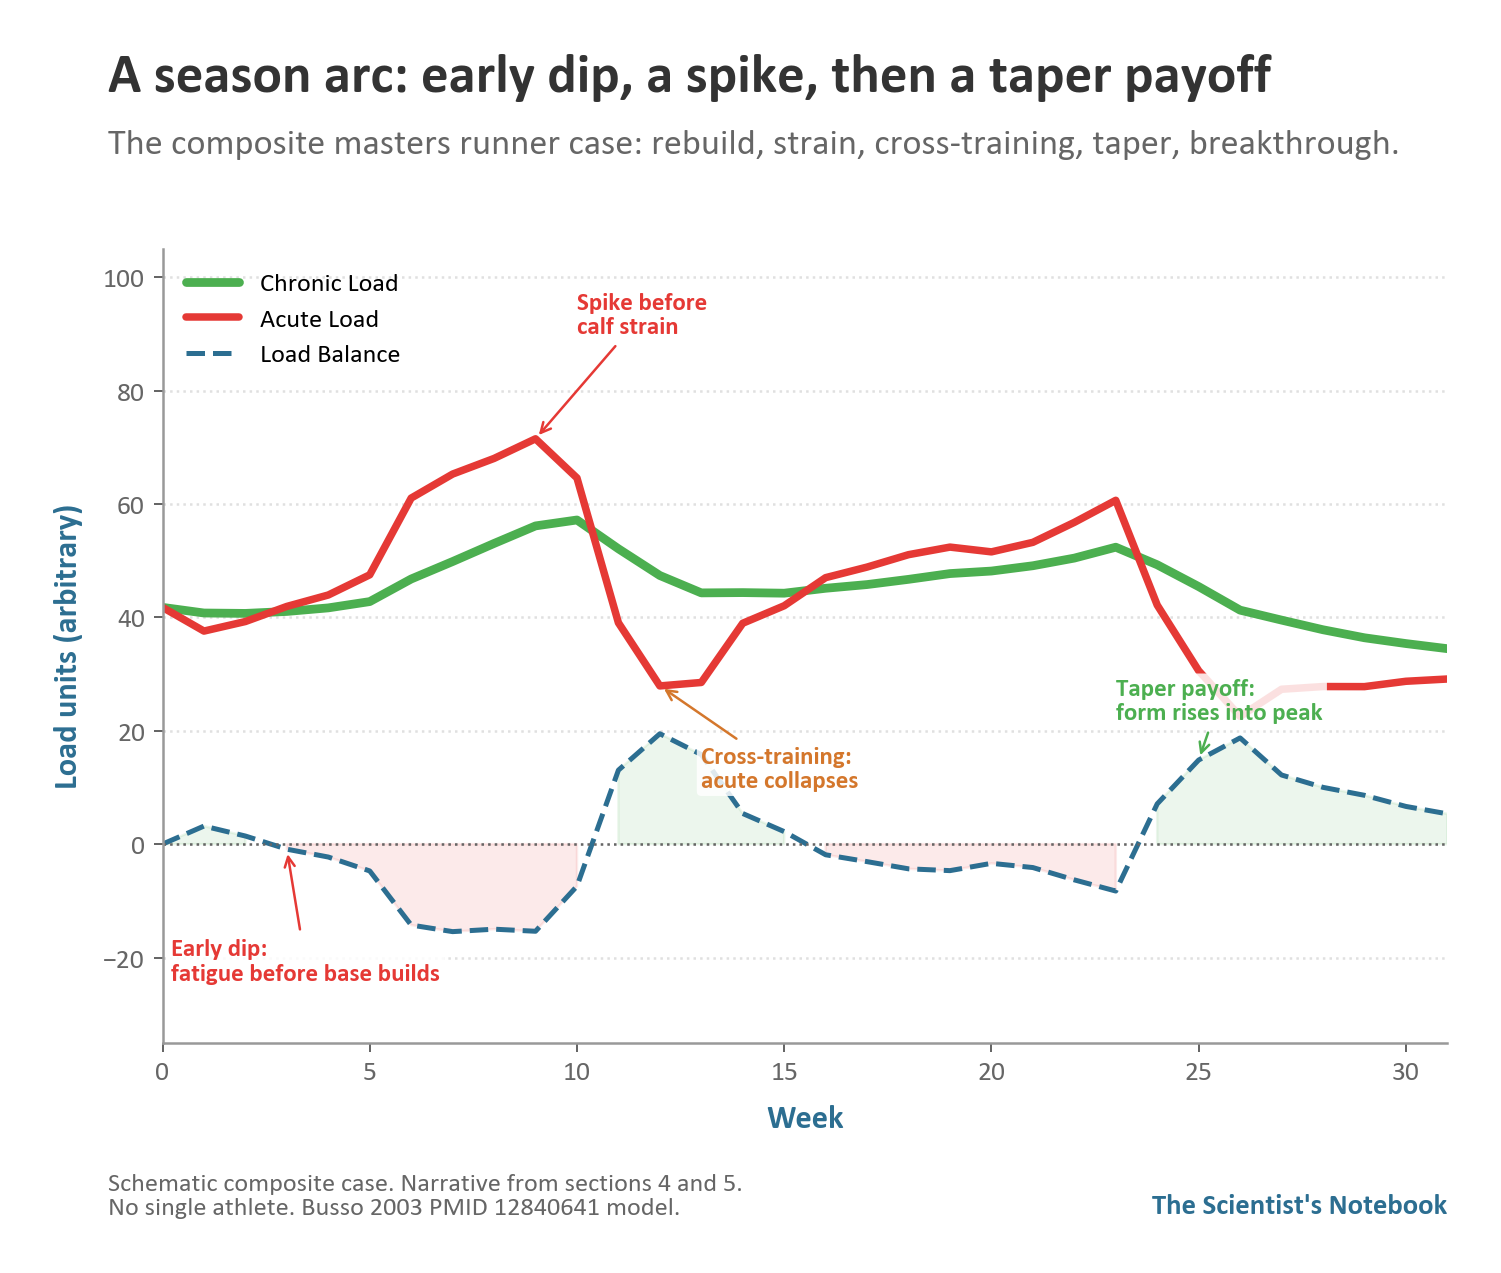
A calf strain arrives right where the model said the risk lived: a high recent spike landing on a base that had not caught up.
A fortnight of cross training follows, and the short line collapses while the long line sags only a little, which on the chart looks deceptively like sharp form on real fitness.
The payoff comes later. The runner resumes, letting the long line lead and keeping the weekly jumps modest, and the body that once buckled at a routine week now absorbs it.
A short taper drops the short line away, the balance swings positive, and the fitness hiding under fatigue surfaces at once. The breakthrough was never a single magic session.
It was patience with the slow line, paid back after a non linear road of dips that no smooth curve predicted.
Where this leaves us
The fitness-fatigue idea endures because it captures something every athlete has felt: that the work and the reward live on different clocks, and that showing up fresh is a separate skill from training hard.
The weighted averages that operationalize it, the long line for fitness, the short line for fatigue, the gap between them for form, are a useful way to see that separation on a screen.
What they cannot do is replace judgment. The single load number that feeds the apparatus erases the difference between easy aerobic work and tendon shredding intervals, even when the scores match.
The ratio that promises to flag danger is partly an artifact of its own arithmetic, and its celebrated safe zone wobbles the moment you change sports, variables, or windows. The chart is a shared language, not a personalized verdict.
The honest posture is to read these tools as instruments rather than oracles, where the trend and the spikes inform but no number knows a body better than the body does, and the curves are one voice in a conversation that also includes sleep, life stress, and how the warm up felt.
A training load chart, of the kind Gradescale surfaces as Load Score, Chronic Load, Acute Load, and Load Balance, earns its place when it informs that conversation instead of trying to end it.
Best regards,
Dr. Thomas Mortelmans
Gradescale: Your physiology, decoded. Join the waitlist now.
 Thomas Mortelmans
Limits of Application: The evidence summarized here draws heavily from team sport and trained athlete populations, often male, often young, and frequently studied over a single competitive season, so its reach into masters athletes, recreational exercisers, and other contexts is uncertain.
Injury and adaptation are multifactorial: biomechanics, sleep, nutrition, prior injury, and plain chance all shape outcomes that no load metric captures, and the acute to chronic ratio in particular carries known statistical weaknesses still under debate.
Nothing here is medical or coaching advice, and it is not a diagnostic tool. It is a descriptive account of what the published literature observes, offered to inform how the numbers on a chart are understood, not to direct any individual's training or health decisions.
References
- Busso T, et al. Adequacy of a systems structure in the modeling of training effects on performance. J Appl Physiol (1985). 1991. PMID 1761506. Statistically tested the two component impulse-response structure and identified the negative component as fatigue, anchoring the fitness-fatigue model.
- Busso T. Variable dose-response relationship between exercise training and performance. Med Sci Sports Exerc. 2003. PMID 12840641. Extended the model to let fatigue magnitude and duration vary, revealing an inverted U between daily training amount and performance.
- Bellinger P. Functional Overreaching in Endurance Athletes: A Necessity or Cause for Concern? Sports Med. 2020. PMID 32064575. Critically reviews the fitness-fatigue continuum and the super-compensation that can follow a deliberate, time limited load increase.
- Tibana RA, et al. Validity of Session Rating Perceived Exertion Method for Quantifying Internal Training Load. Sports (Basel). 2018. PMID 30041435. Validated the session rating of perceived exertion against a heart rate reference, supporting effort times duration as a practical daily load score.
- Halson SL. Monitoring training load to understand fatigue in athletes. Sports Med. 2014. PMID 25200666. A foundational review of internal and external load markers and how their dissociation can reveal an athlete's fatigue state.
- Impellizzeri FM, et al. Understanding Training Load as Exposure and Dose. Sports Med. 2023. PMID 37022589. Reframes training load through epidemiological concepts of exposure and dose, clarifying what a load metric must reflect to be useful.
- Gabbett TJ. The training-injury prevention paradox: should athletes be training smarter and harder? Br J Sports Med. 2016. PMID 26758673. Introduced the acute to chronic workload framing and the argument that a high, well built chronic base protects rather than harms.
- Maupin D, et al. The Relationship Between Acute:Chronic Workload Ratios and Injury Risk in Sports: A Systematic Review. Open Access J Sports Med. 2020. PMID 32158285. Synthesizes twenty seven studies, noting a trend toward lowest injury risk near the proposed band while flagging high variability across methods.
- Lolli L, et al. Mathematical coupling causes spurious correlation within the conventional acute-to-chronic workload ratio calculations. Br J Sports Med. 2017. PMID 29101104. Demonstrates that embedding acute load inside chronic load can manufacture an apparent ratio to injury relationship statistically.
- Hunter B, et al. Durability as an index of endurance exercise performance: Methodological considerations. Exp Physiol. 2025. PMID 40150840. Reviews durability, the resilience of physiological profiles during prolonged exercise, a quality that a single fresh state load chart cannot capture.
- Bouchard C, et al. Genomic predictors of the maximal O2 uptake response to standardized exercise training programs. J Appl Physiol (1985). 2011. PMID 21183627. Identified a panel of gene variants explaining roughly half the variance in aerobic trainability, quantifying how unevenly bodies respond to identical work.
- Rice TK, et al. Fine mapping of a QTL on chromosome 13 for submaximal exercise capacity training response: the HERITAGE Family Study. Eur J Appl Physiol. 2011. PMID 22170014. Part of the family study showing substantial heritability of the adaptation response, underscoring individual calibration over universal thresholds.
- Bosquet L, et al. Effects of tapering on performance: a meta-analysis. Med Sci Sports Exerc. 2007. PMID 17762369. Pooled twenty seven studies to show a two week taper with a large volume reduction maximizes performance, the practical proof that fatigue clears faster than fitness.
- Kellmann M, et al. Recovery and Performance in Sport: Consensus Statement. Int J Sports Physiol Perform. 2018. PMID 29345524. An expert consensus arguing that the stress to recovery balance, not load alone, governs whether training yields adaptation or breakdown.
- Moesgaard L, et al. Effects of Periodization on Strength and Muscle Hypertrophy in Volume-Equated Resistance Training Programs: A Systematic Review and Meta-analysis. Sports Med. 2022. PMID 35044672. Shows that how load is sequenced over time, not just its total, shapes the adaptation, reinforcing that timing is a lever in its own right.
---
If you have 60 seconds, I would value your anonymous feedback. You can share it here.
---
Health disclaimer
This post discusses endurance-training science for educational purposes. It is not medical advice, not a diagnosis, and not a substitute for clinical care. Individual response to training, sleep deprivation, and multi-day exertion varies substantially, and what applies to a research cohort or a world-class athlete may not apply to you. Consult a qualified physician, sports medicine specialist, or registered dietitian before changing your training, fuelling, or sleep strategy if you have a cardiovascular, metabolic, psychiatric, or sleep-related condition; are recovering from injury or illness; are pregnant; are on medication that affects heart rate, hydration, glucose regulation, or sleep; or have concerns about exercise tolerance. Ultra-endurance events impose real physiological and psychological loads. Persistent chest pain, fainting, acute confusion beyond the predictable late-race window, severe dehydration, sustained loss of coordination, or any mental-health symptoms that outlast the immediate post-event dip warrant professional care and are not signals to push through. No outcome is guaranteed. The protocols, anchors, and case material in this post are descriptive, drawn from peer-reviewed evidence and a guest contributor's lived experience, and should be treated as inputs to an informed conversation with your own coach and clinicians, not as prescriptions.
Found this useful?
Get articles like this and free training calculators in your inbox every week.
Recommended reads
If this was useful, these are the other research-driven newsletters I actually read.




Member discussion